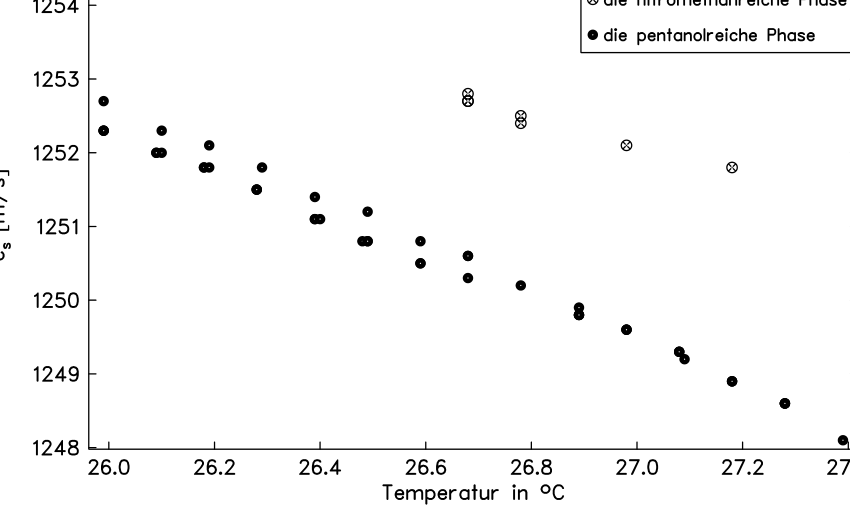
Figure 5.8. Speed of sound in the phase-separated state, determined by the automated apparatus.
The recorded values alternate between the sound velocities of components A and B, reflecting the determination of the center frequencies. The apparatus happens to register the center frequency of either component A or component B. The result therefore indicates the presence of two liquid phases. It must be emphasized, however, that the velocities measured below the critical temperature are not those of pure nitromethane or pure pentanol.
The structure of the measured curve is very similar to that reported by Chynoweth and Schneider for the water–triethylamine system at f = 0.6 MHz (see the cited source, p. 91, and [54]). The emergence of the two-phase region is also clearly apparent in their measurements.
To record the transition more distinctly and examine the substance after phase separation, specialized sound-velocity cells use two transmitting and two receiving transducers in a single cell. This allows the two phases to be measured separately and more accurately after separation. The resulting temperature curve typically has a fork-like shape.