Chapter 5 · Evaluation and Analysis
Fitting the measured values (see Fig. 5.6) yields the following parameter values A and B when C is set to zero:

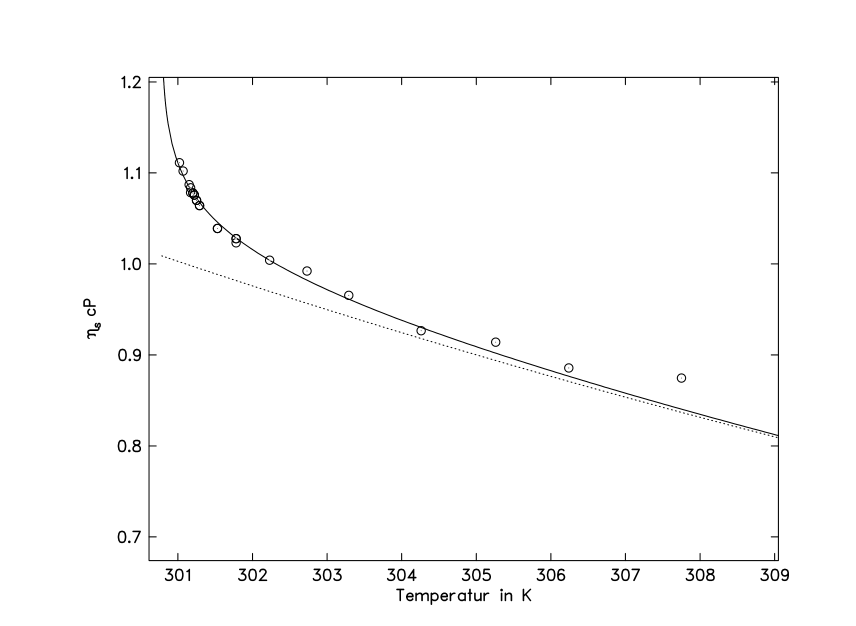
Figure 5.6. Viscosity according to Eq. (5.7), solid line, with the fitted background contribution ηbg, dotted line.
A shear-rate correction is not required, since it becomes significant only extremely close to the critical point [53]. The measurement range relevant to light scattering lies close to the critical point. In this region the following relation holds, involving the system-dependent amplitude Q₀ [23]:

Here the critical viscosity exponent is Zη = 0.065, and ξ is the correlation length, which is discussed in a later chapter.