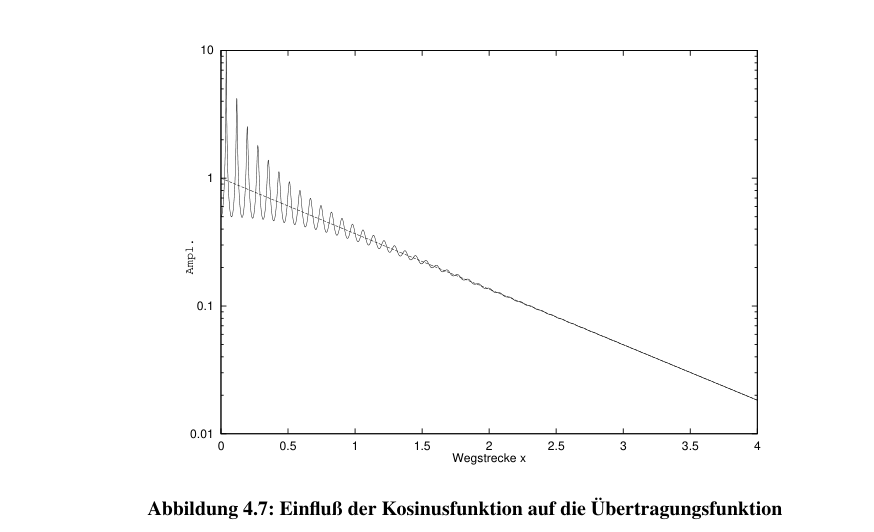
Figure 4.7: Influence of the cosine function on the transfer function.
… the voltage UAD is not linear. To determine the attenuation, we therefore seek a function K satisfying the following relation:

For this purpose, a measurement is performed using a so-called cut-off attenuator. It is activated after an acoustic measurement and determines the characteristic curve. A more detailed description of this procedure can be found in [38]. Some of the instrumental losses already discussed for the resonators also occur in this method.
Up to this point, only the generation of a plane wave has been assumed. The transducer, however, has a finite extent and can be described as a piston radiator, which generates a corresponding sound field (see Figure 4.8). The greater the distance between receiver and transmitter, the more the sound field spreads. The received acoustic power decreases as the wave spreads, so the attenuation determined for the liquid is systematically too high. As with the resonator, a correction term is therefore required to represent the data accurately.
Mathematical relationships for this effect were published by Fay [41] and Khimunin [42]. Unfortunately, their treatment considered only the idealized case. A further, more successful empirical treatment of this problem was developed by Menzel [43]:
