5.2 Preparation of the Sample

In the present work, the mole fraction x = 0.385 was chosen because this corresponds to the maximum of the binodal curve (Fig. 5.1). Thus, for the system investigated:

After some elementary rearrangements and substitution of the molar masses, a simple relationship is obtained for sample preparation between the masses of nitromethane and pentanol, linked by a proportionality factor:

The same procedure naturally applies to all other mole fractions.
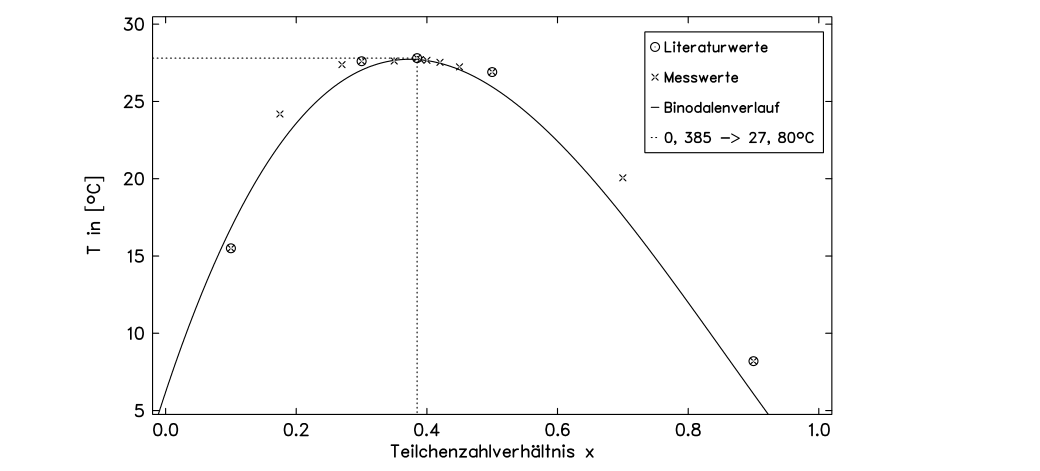
Figure 5.1. Binodal curve of the critical nitromethane–pentanol system.
As shown in Figure 5.1, the point (0.385, 27.8 °C) is highlighted because it plays the central role in this work. The literature values were taken from Łabowski and Hornowski [45].
Original mathematical notation and figures are preserved as extracted image assets.