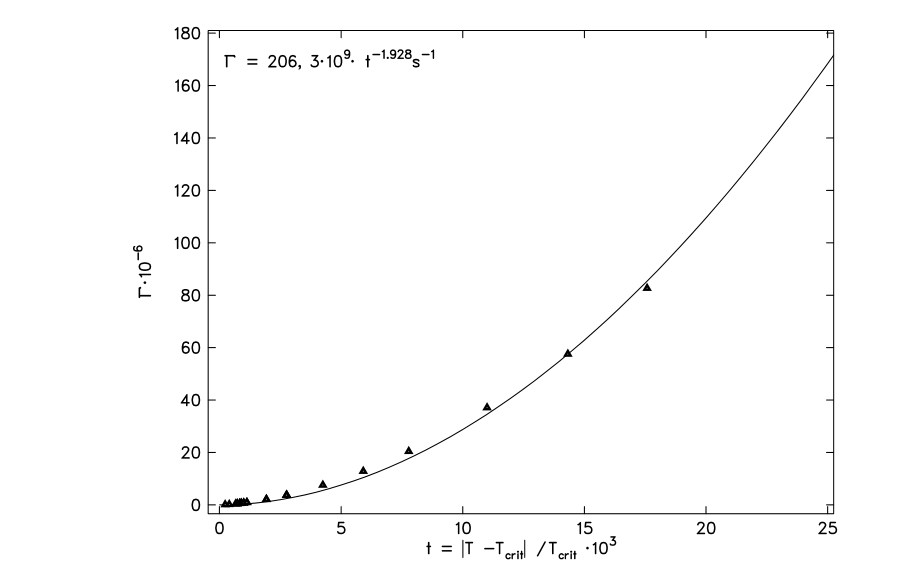
Figure 5.18. Characteristic relaxation rates from light scattering and viscosity.
1. Selection of the measurement at Tcrit
An ultrasonic measurement as close as possible to the critical point is selected. The chosen temperature was T = 27.81 °C, corresponding approximately to Tcrit = 27.80 °C. Since the Bhattacharjee–Ferrell function satisfies F(Ω) = 1 at the critical point, Eq. (3.47) allows the proximity to the critical point to be checked.
Plotting the critical contribution to the attenuation against frequency yields Fig. 5.19. This plot contains the B-value-corrected measured values, the fitted Bhattacharjee–Ferrell term and the theoretical behavior of the critical contribution. The conventional representation uses α/f² (Fig. 5.20). The slope S obtained from the amplitude of the fitted critical contribution is:
