Chapter 5 · Evaluation and Analysis
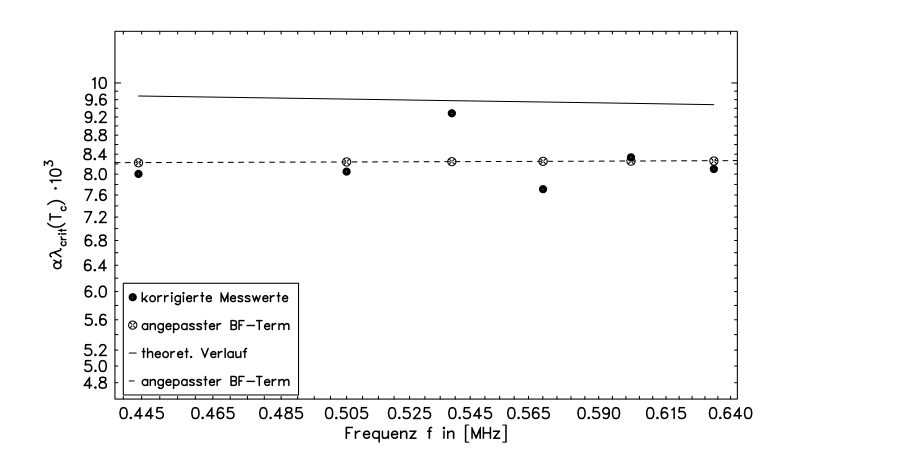
Figure 5.19. Critical contribution to sound attenuation (αλcrit) at T = 27.81 °C.
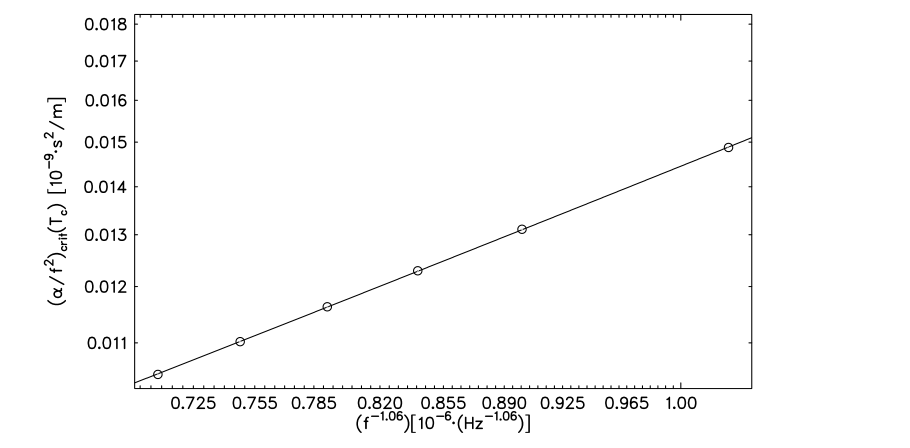
Figure 5.20. Sound attenuation.
The data are now fitted again, with ABF treated as a free parameter and ωBF varied until the experimental data fall on the theoretical function FBF. The sound velocity cs is specified from the resonator measurements. The fit uses the experimentally determined critical temperature from light scattering, T = 300.84 K = 27.69 °C, because the critical temperature obtained from the ultrasonic measurements is uncertain.