Original English dissertation · scientific equations reproduced directly from the source PDF.
2.2 Critical fluctuations
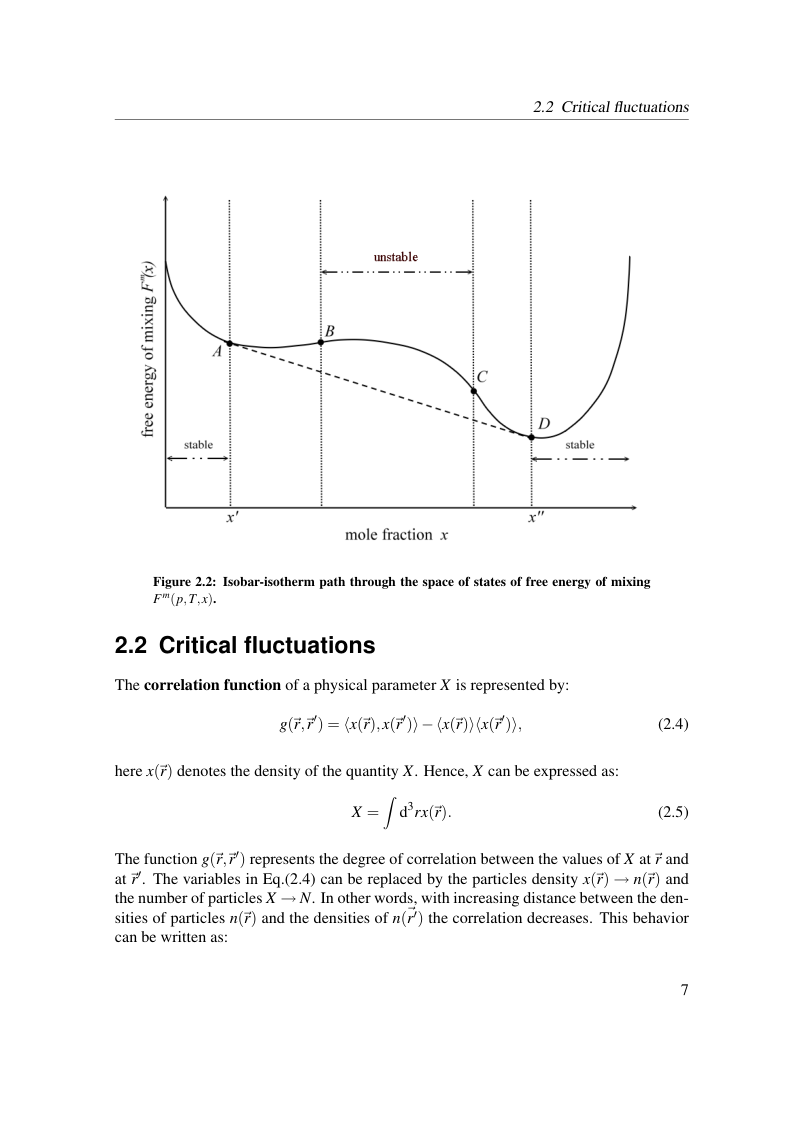
Figure 2.2: Isobar-isotherm path through the space of states of free energy of mixing Fm(p,T,x).
2.2 Critical fluctuations
The correlation function of a physical parameter X is represented by:

here x(⃗r) denotes the density of the quantity X. Hence, X can be expressed as:

The function g(⃗r,⃗r′) represents the degree of correlation between the values of X at⃗r and at⃗r′. The variables in Eq.(2.4) can be replaced by the particles density x(⃗r) →n(⃗r) and the number of particles X →N. In other words, with increasing distance between the den- sities of particles n(⃗r) and the densities of n(⃗r′) the correlation decreases. This behavior can be written as:
View original page 13 (authoritative equations, figures and layout)
Original dissertation · PDF page 13 · reader page 6 of 132