Original English dissertation · scientific equations reproduced directly from the source PDF.
5 Experimental Verification of Dynamic Scaling Theories and Discussions
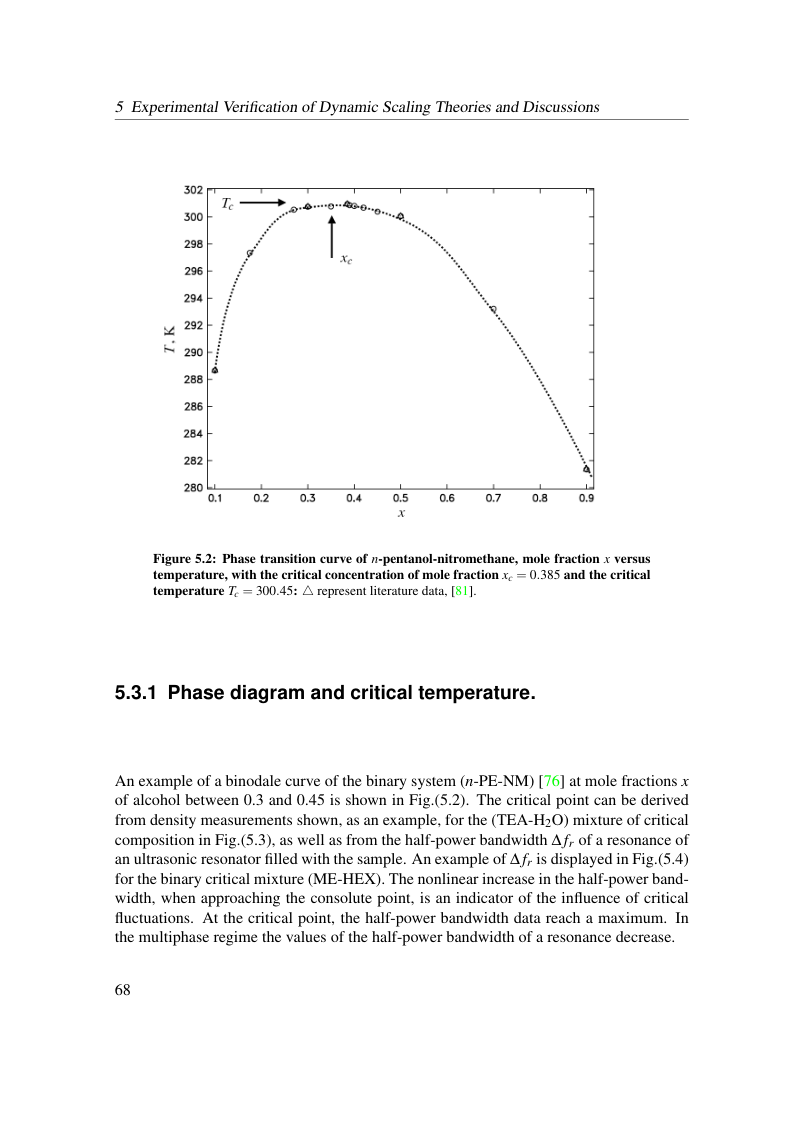
Figure 5.2: Phase transition curve of n-pentanol-nitromethane, mole fraction x versus temperature, with the critical concentration of mole fraction xc = 0.385 and the critical temperature Tc = 300.45: △represent literature data, [81].
5.3.1 Phase diagram and critical temperature.
An example of a binodale curve of the binary system (n-PE-NM) [76] at mole fractions x of alcohol between 0.3 and 0.45 is shown in Fig.(5.2). The critical point can be derived from density measurements shown, as an example, for the (TEA-H2O) mixture of critical composition in Fig.(5.3), as well as from the half-power bandwidth ∆fr of a resonance of an ultrasonic resonator filled with the sample. An example of ∆fr is displayed in Fig.(5.4) for the binary critical mixture (ME-HEX). The nonlinear increase in the half-power band- width, when approaching the consolute point, is an indicator of the influence of critical fluctuations. At the critical point, the half-power bandwidth data reach a maximum. In the multiphase regime the values of the half-power bandwidth of a resonance decrease.
View original page 74 (authoritative equations, figures and layout)
Original dissertation · PDF page 74 · reader page 65 of 132