Original English dissertation · scientific equations reproduced directly from the source PDF.
5.7 Ternary system nitroethane-3-methylpentane-cyclohexane
numbers qc and qD on the background viscosity ηbg has been studied with more details as in the case of binary fluids. The measurements of viscosity, light scattering as well as ultrasonic attenuation have been performed with the same instrumental setup as for the other critical mixtures with the critical parameters of the mixtures in Table (5.5).
5.7.1 Crossover studies of viscosity and light scattering
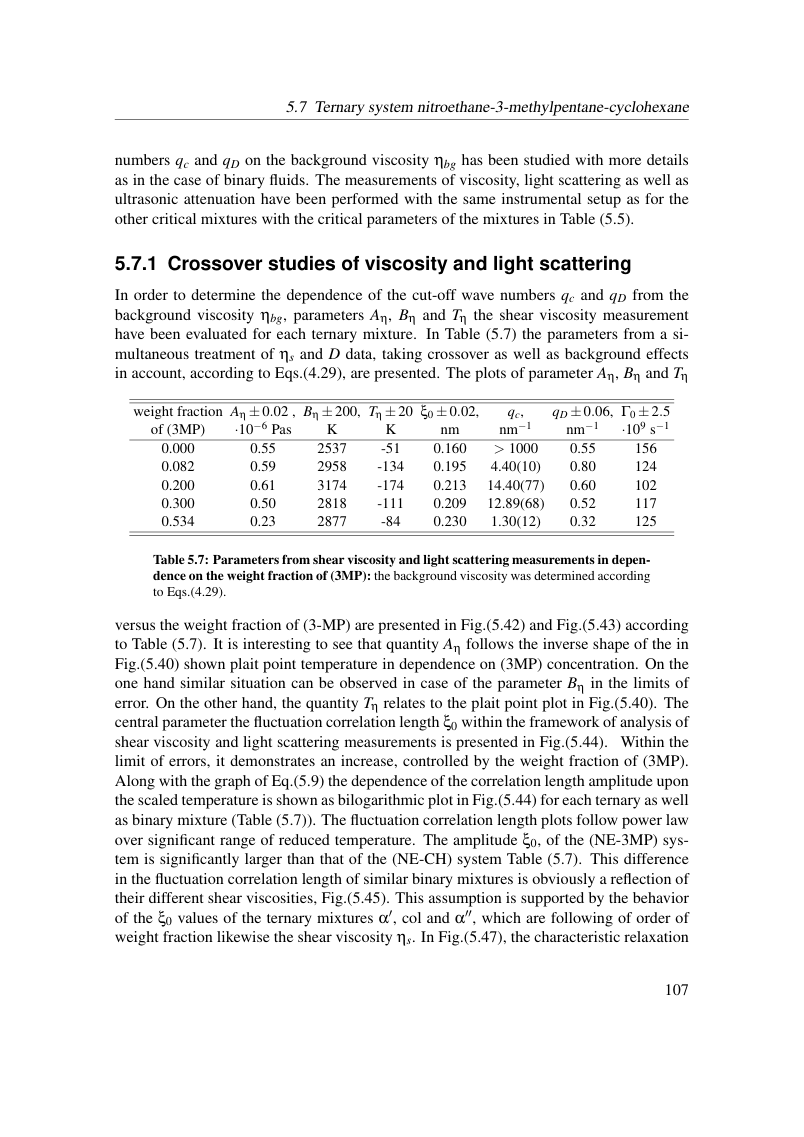
In order to determine the dependence of the cut-off wave numbers qc and qD from the background viscosity ηbg, parameters Aη, Bη and Tη the shear viscosity measurement have been evaluated for each ternary mixture. In Table (5.7) the parameters from a si- multaneous treatment of ηs and D data, taking crossover as well as background effects in account, according to Eqs.(4.29), are presented. The plots of parameter Aη, Bη and Tη
weight fraction Aη ±0.02 , Bη ±200, Tη ±20 ξ0 ±0.02, qc, qD ±0.06, Γ0 ±2.5 of (3MP) ·10−6 Pas K K nm nm−1 nm−1 ·109 s−1
0.000 0.55 2537 -51 0.160 > 1000 0.55 156 0.082 0.59 2958 -134 0.195 4.40(10) 0.80 124 0.200 0.61 3174 -174 0.213 14.40(77) 0.60 102 0.300 0.50 2818 -111 0.209 12.89(68) 0.52 117 0.534 0.23 2877 -84 0.230 1.30(12) 0.32 125
Table 5.7: Parameters from shear viscosity and light scattering measurements in depen- dence on the weight fraction of (3MP): the background viscosity was determined according to Eqs.(4.29).
versus the weight fraction of (3-MP) are presented in Fig.(5.42) and Fig.(5.43) according to Table (5.7). It is interesting to see that quantity Aη follows the inverse shape of the in Fig.(5.40) shown plait point temperature in dependence on (3MP) concentration. On the one hand similar situation can be observed in case of the parameter Bη in the limits of error. On the other hand, the quantity Tη relates to the plait point plot in Fig.(5.40). The central parameter the fluctuation correlation length ξ0 within the framework of analysis of shear viscosity and light scattering measurements is presented in Fig.(5.44). Within the limit of errors, it demonstrates an increase, controlled by the weight fraction of (3MP). Along with the graph of Eq.(5.9) the dependence of the correlation length amplitude upon the scaled temperature is shown as bilogarithmic plot in Fig.(5.44) for each ternary as well as binary mixture (Table (5.7)). The fluctuation correlation length plots follow power law over significant range of reduced temperature. The amplitude ξ0, of the (NE-3MP) sys- tem is significantly larger than that of the (NE-CH) system Table (5.7). This difference in the fluctuation correlation length of similar binary mixtures is obviously a reflection of their different shear viscosities, Fig.(5.45). This assumption is supported by the behavior of the ξ0 values of the ternary mixtures α′, col and α′′, which are following of order of weight fraction likewise the shear viscosity ηs. In Fig.(5.47), the characteristic relaxation
View original page 113 (authoritative equations, figures and layout)
Original dissertation · PDF page 113 · reader page 104 of 132