Original English dissertation · scientific equations reproduced directly from the source PDF.
5 Experimental Verification of Dynamic Scaling Theories and Discussions
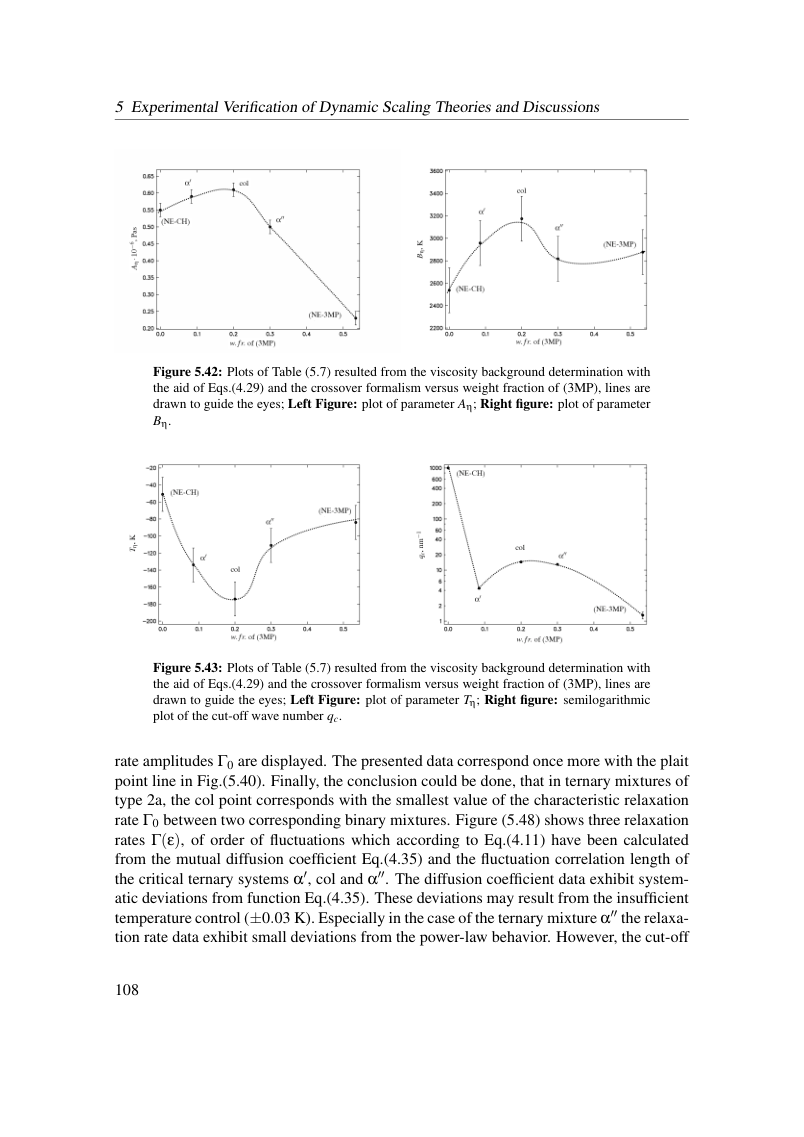
Figure 5.42: Plots of Table (5.7) resulted from the viscosity background determination with the aid of Eqs.(4.29) and the crossover formalism versus weight fraction of (3MP), lines are drawn to guide the eyes; Left Figure: plot of parameter Aη; Right figure: plot of parameter Bη.
Figure 5.43: Plots of Table (5.7) resulted from the viscosity background determination with the aid of Eqs.(4.29) and the crossover formalism versus weight fraction of (3MP), lines are drawn to guide the eyes; Left Figure: plot of parameter Tη; Right figure: semilogarithmic plot of the cut-off wave number qc.
rate amplitudes Γ0 are displayed. The presented data correspond once more with the plait point line in Fig.(5.40). Finally, the conclusion could be done, that in ternary mixtures of type 2a, the col point corresponds with the smallest value of the characteristic relaxation rate Γ0 between two corresponding binary mixtures. Figure (5.48) shows three relaxation rates Γ(ε), of order of fluctuations which according to Eq.(4.11) have been calculated from the mutual diffusion coefficient Eq.(4.35) and the fluctuation correlation length of the critical ternary systems α′, col and α′′. The diffusion coefficient data exhibit system- atic deviations from function Eq.(4.35). These deviations may result from the insufficient temperature control (±0.03 K). Especially in the case of the ternary mixture α′′ the relaxa- tion rate data exhibit small deviations from the power-law behavior. However, the cut-off
View original page 114 (authoritative equations, figures and layout)
Original dissertation · PDF page 114 · reader page 105 of 132