Original English dissertation · scientific equations reproduced directly from the source PDF.
5 Experimental Verification of Dynamic Scaling Theories and Discussions
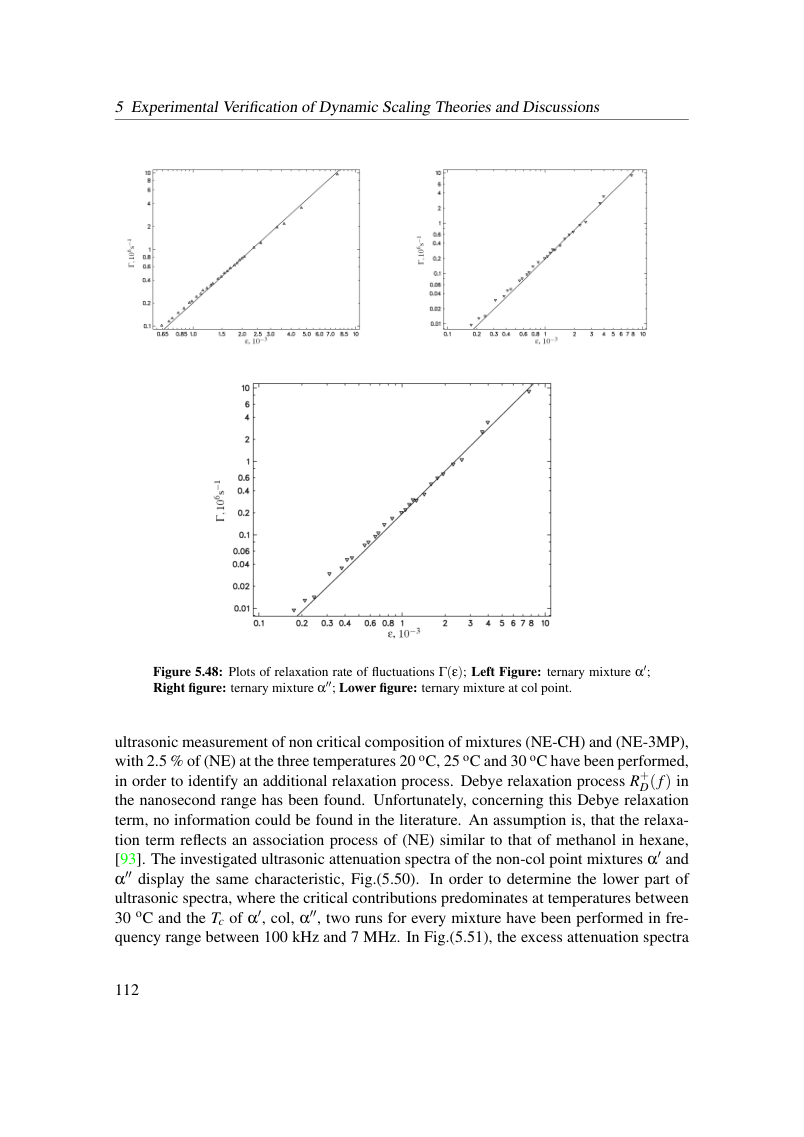
Figure 5.48: Plots of relaxation rate of fluctuations Γ(ε); Left Figure: ternary mixture α′; Right figure: ternary mixture α′′; Lower figure: ternary mixture at col point.
ultrasonic measurement of non critical composition of mixtures (NE-CH) and (NE-3MP), with 2.5 % of (NE) at the three temperatures 20 oC, 25 oC and 30 oC have been performed, in order to identify an additional relaxation process. Debye relaxation process R+ D(f) in the nanosecond range has been found. Unfortunately, concerning this Debye relaxation term, no information could be found in the literature. An assumption is, that the relaxa- tion term reflects an association process of (NE) similar to that of methanol in hexane, [93]. The investigated ultrasonic attenuation spectra of the non-col point mixtures α′ and α′′ display the same characteristic, Fig.(5.50). In order to determine the lower part of ultrasonic spectra, where the critical contributions predominates at temperatures between 30 oC and the Tc of α′, col, α′′, two runs for every mixture have been performed in fre- quency range between 100 kHz and 7 MHz. In Fig.(5.51), the excess attenuation spectra
View original page 118 (authoritative equations, figures and layout)
Original dissertation · PDF page 118 · reader page 109 of 132