Original English dissertation · scientific equations reproduced directly from the source PDF.
5.7 Ternary system nitroethane-3-methylpentane-cyclohexane
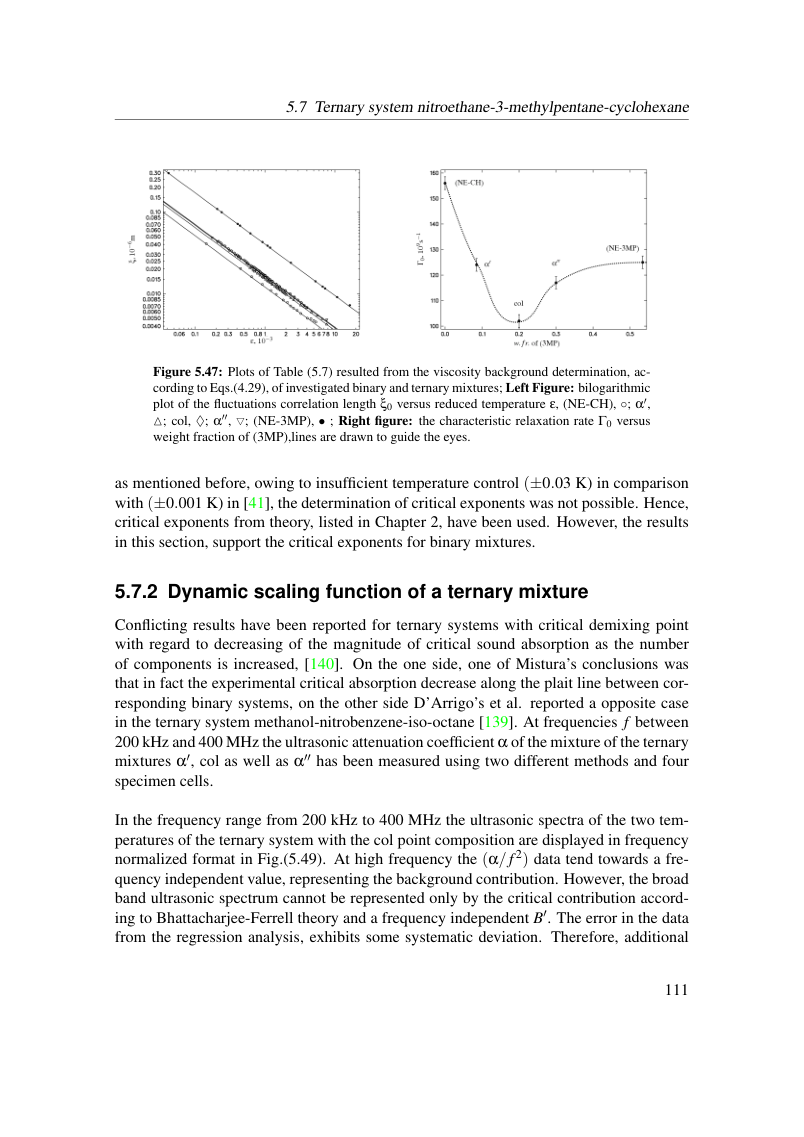
Figure 5.47: Plots of Table (5.7) resulted from the viscosity background determination, ac- cording to Eqs.(4.29), of investigated binary and ternary mixtures; Left Figure: bilogarithmic plot of the fluctuations correlation length ξ0 versus reduced temperature ε, (NE-CH), ◦; α′, △; col, ♦; α′′, ▽; (NE-3MP), • ; Right figure: the characteristic relaxation rate Γ0 versus weight fraction of (3MP),lines are drawn to guide the eyes.
as mentioned before, owing to insufficient temperature control (±0.03 K) in comparison with (±0.001 K) in [41], the determination of critical exponents was not possible. Hence, critical exponents from theory, listed in Chapter 2, have been used. However, the results in this section, support the critical exponents for binary mixtures.
5.7.2 Dynamic scaling function of a ternary mixture
Conflicting results have been reported for ternary systems with critical demixing point with regard to decreasing of the magnitude of critical sound absorption as the number of components is increased, [140]. On the one side, one of Mistura’s conclusions was that in fact the experimental critical absorption decrease along the plait line between cor- responding binary systems, on the other side D’Arrigo’s et al. reported a opposite case in the ternary system methanol-nitrobenzene-iso-octane [139]. At frequencies f between 200 kHz and 400 MHz the ultrasonic attenuation coefficient α of the mixture of the ternary mixtures α′, col as well as α′′ has been measured using two different methods and four specimen cells.
In the frequency range from 200 kHz to 400 MHz the ultrasonic spectra of the two tem- peratures of the ternary system with the col point composition are displayed in frequency normalized format in Fig.(5.49). At high frequency the (α/ f 2) data tend towards a fre- quency independent value, representing the background contribution. However, the broad band ultrasonic spectrum cannot be represented only by the critical contribution accord- ing to Bhattacharjee-Ferrell theory and a frequency independent B′. The error in the data from the regression analysis, exhibits some systematic deviation. Therefore, additional
View original page 117 (authoritative equations, figures and layout)
Original dissertation · PDF page 117 · reader page 108 of 132