Original English dissertation · scientific equations reproduced directly from the source PDF.
5.8 Summarized parameters and surface tension in critical mixtures
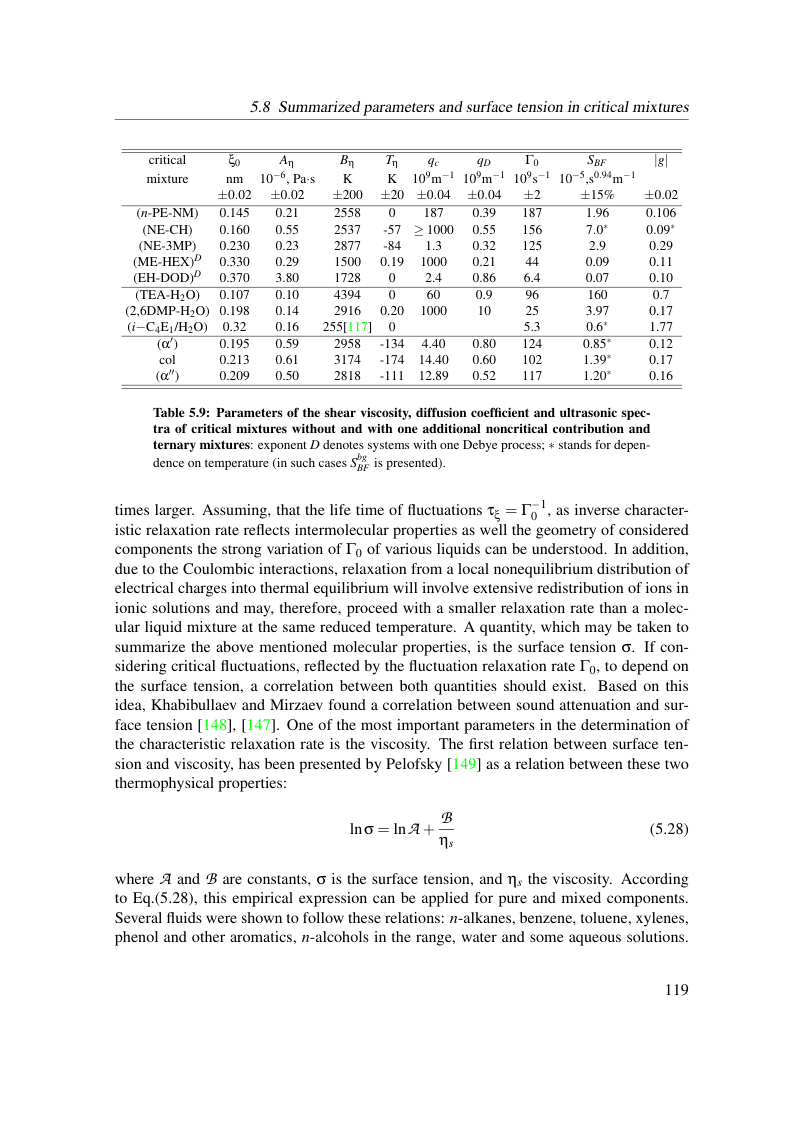
critical ξ0 Aη Bη Tη qc qD Γ0 SBF |g| mixture nm 10−6, Pa·s K K 109m−1 109m−1 109s−1 10−5,s0.94m−1
±0.02 ±0.02 ±200 ±20 ±0.04 ±0.04 ±2 ±15% ±0.02 (n-PE-NM) 0.145 0.21 2558 0 187 0.39 187 1.96 0.106 (NE-CH) 0.160 0.55 2537 -57 ≥1000 0.55 156 7.0∗ 0.09∗
(NE-3MP) 0.230 0.23 2877 -84 1.3 0.32 125 2.9 0.29 (ME-HEX)D 0.330 0.29 1500 0.19 1000 0.21 44 0.09 0.11 (EH-DOD)D 0.370 3.80 1728 0 2.4 0.86 6.4 0.07 0.10 (TEA-H2O) 0.107 0.10 4394 0 60 0.9 96 160 0.7 (2,6DMP-H2O) 0.198 0.14 2916 0.20 1000 10 25 3.97 0.17 (i−C4E1/H2O) 0.32 0.16 255[117] 0 5.3 0.6∗ 1.77 (α′) 0.195 0.59 2958 -134 4.40 0.80 124 0.85∗ 0.12 col 0.213 0.61 3174 -174 14.40 0.60 102 1.39∗ 0.17 (α′′) 0.209 0.50 2818 -111 12.89 0.52 117 1.20∗ 0.16
Table 5.9: Parameters of the shear viscosity, diffusion coefficient and ultrasonic spec- tra of critical mixtures without and with one additional noncritical contribution and ternary mixtures: exponent D denotes systems with one Debye process; ∗stands for depen- dence on temperature (in such cases Sbg BF is presented).
times larger. Assuming, that the life time of fluctuations τξ = Γ−1 0 , as inverse character- istic relaxation rate reflects intermolecular properties as well the geometry of considered components the strong variation of Γ0 of various liquids can be understood. In addition, due to the Coulombic interactions, relaxation from a local nonequilibrium distribution of electrical charges into thermal equilibrium will involve extensive redistribution of ions in ionic solutions and may, therefore, proceed with a smaller relaxation rate than a molec- ular liquid mixture at the same reduced temperature. A quantity, which may be taken to summarize the above mentioned molecular properties, is the surface tension σ. If con- sidering critical fluctuations, reflected by the fluctuation relaxation rate Γ0, to depend on the surface tension, a correlation between both quantities should exist. Based on this idea, Khabibullaev and Mirzaev found a correlation between sound attenuation and sur- face tension [148], [147]. One of the most important parameters in the determination of the characteristic relaxation rate is the viscosity. The first relation between surface ten- sion and viscosity, has been presented by Pelofsky [149] as a relation between these two thermophysical properties:

where A and B are constants, σ is the surface tension, and ηs the viscosity. According to Eq.(5.28), this empirical expression can be applied for pure and mixed components. Several fluids were shown to follow these relations: n-alkanes, benzene, toluene, xylenes, phenol and other aromatics, n-alcohols in the range, water and some aqueous solutions.
View original page 125 (authoritative equations, figures and layout)
Original dissertation · PDF page 125 · reader page 116 of 132