Original English dissertation · scientific equations reproduced directly from the source PDF.
2.4 Phase diagrams
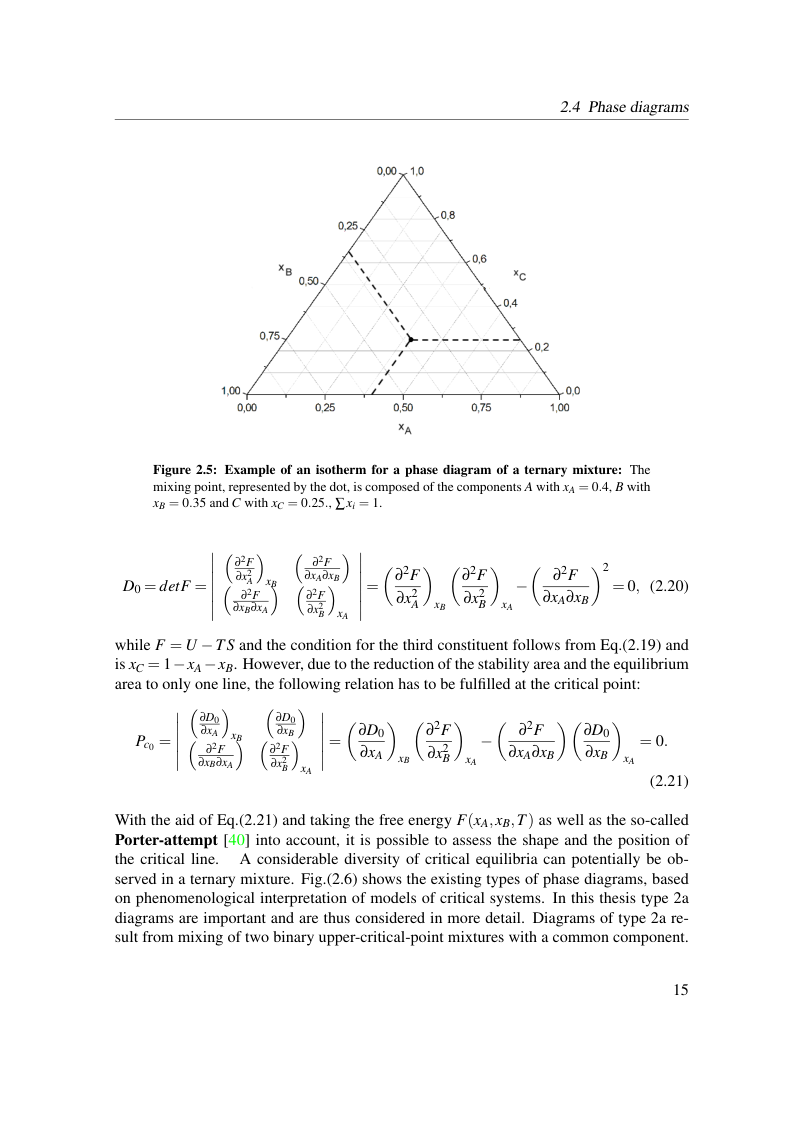
Figure 2.5: Example of an isotherm for a phase diagram of a ternary mixture: The mixing point, represented by the dot, is composed of the components A with xA = 0.4, B with xB = 0.35 and C with xC = 0.25., ∑xi = 1.

while F = U −TS and the condition for the third constituent follows from Eq.(2.19) and is xC = 1−xA−xB. However, due to the reduction of the stability area and the equilibrium area to only one line, the following relation has to be fulfilled at the critical point:

With the aid of Eq.(2.21) and taking the free energy F(xA,xB,T) as well as the so-called Porter-attempt [40] into account, it is possible to assess the shape and the position of the critical line. A considerable diversity of critical equilibria can potentially be ob- served in a ternary mixture. Fig.(2.6) shows the existing types of phase diagrams, based on phenomenological interpretation of models of critical systems. In this thesis type 2a diagrams are important and are thus considered in more detail. Diagrams of type 2a re- sult from mixing of two binary upper-critical-point mixtures with a common component.
View original page 21 (authoritative equations, figures and layout)
Original dissertation · PDF page 21 · reader page 14 of 132