Original English dissertation · scientific equations reproduced directly from the source PDF.
2 Thermodynamics of Critical Phenomena
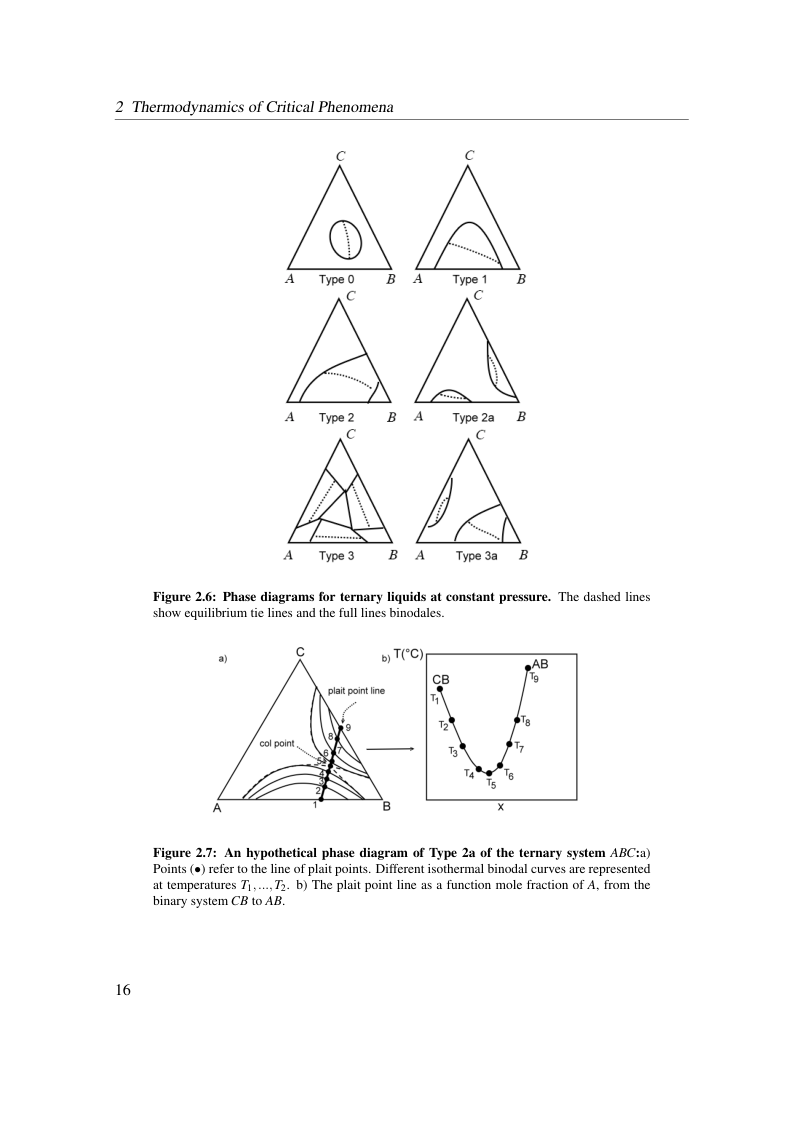
Figure 2.6: Phase diagrams for ternary liquids at constant pressure. The dashed lines show equilibrium tie lines and the full lines binodales.
Figure 2.7: An hypothetical phase diagram of Type 2a of the ternary system ABC:a) Points (•) refer to the line of plait points. Different isothermal binodal curves are represented at temperatures T1,...,T2. b) The plait point line as a function mole fraction of A, from the binary system CB to AB.
View original page 22 (authoritative equations, figures and layout)
Original dissertation · PDF page 22 · reader page 15 of 132