Original English dissertation · scientific equations reproduced directly from the source PDF.
5 Experimental Verification of Dynamic Scaling Theories and Discussions
Figure 5.6: Bilogarithmic plot D −ε of (n-PE-NM), in which the line represents power law behavior, Eq.(5.10).
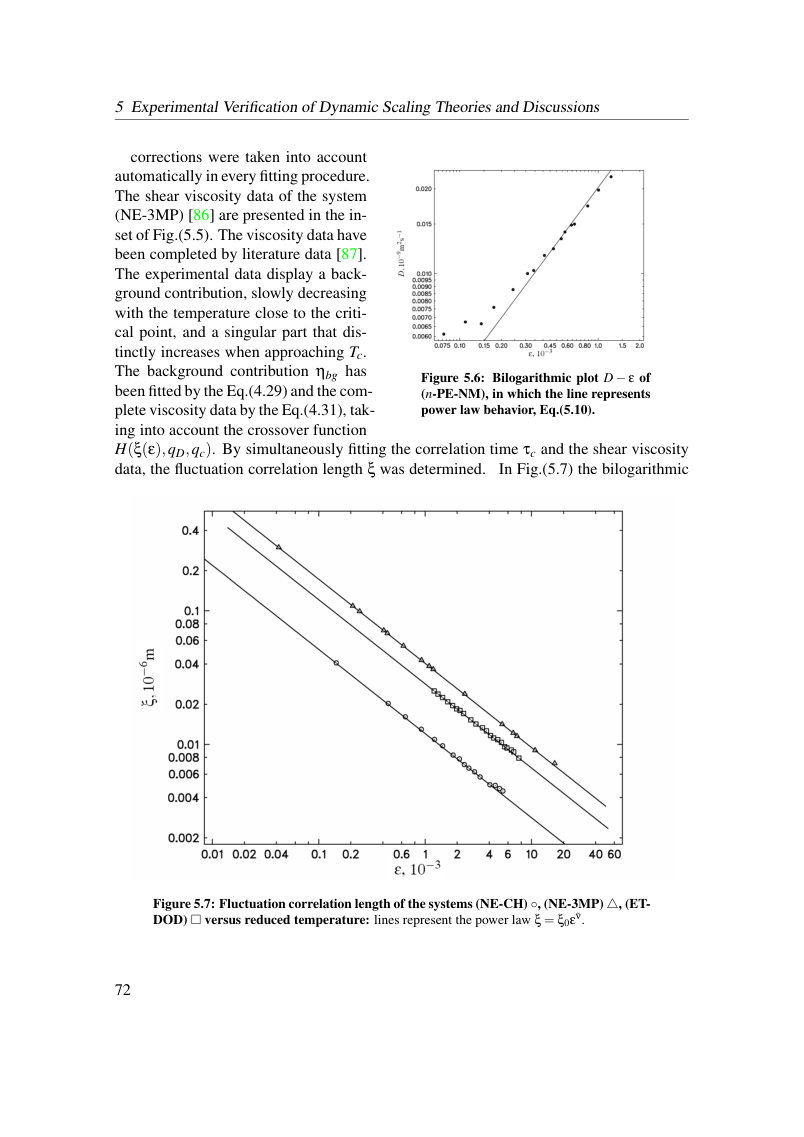
corrections were taken into account automatically in every fitting procedure. The shear viscosity data of the system (NE-3MP) [86] are presented in the in- set of Fig.(5.5). The viscosity data have been completed by literature data [87]. The experimental data display a back- ground contribution, slowly decreasing with the temperature close to the criti- cal point, and a singular part that dis- tinctly increases when approaching Tc. The background contribution ηbg has been fitted by the Eq.(4.29) and the com- plete viscosity data by the Eq.(4.31), tak- ing into account the crossover function H(ξ(ε),qD,qc). By simultaneously fitting the correlation time τc and the shear viscosity data, the fluctuation correlation length ξ was determined. In Fig.(5.7) the bilogarithmic
Figure 5.7: Fluctuation correlation length of the systems (NE-CH) ◦, (NE-3MP) △, (ET- DOD) □versus reduced temperature: lines represent the power law ξ = ξ0ε˜ν.
View original page 78 (authoritative equations, figures and layout)
Original dissertation · PDF page 78 · reader page 69 of 132