Original English dissertation · scientific equations reproduced directly from the source PDF.
5.4 Fluctuation correlation length
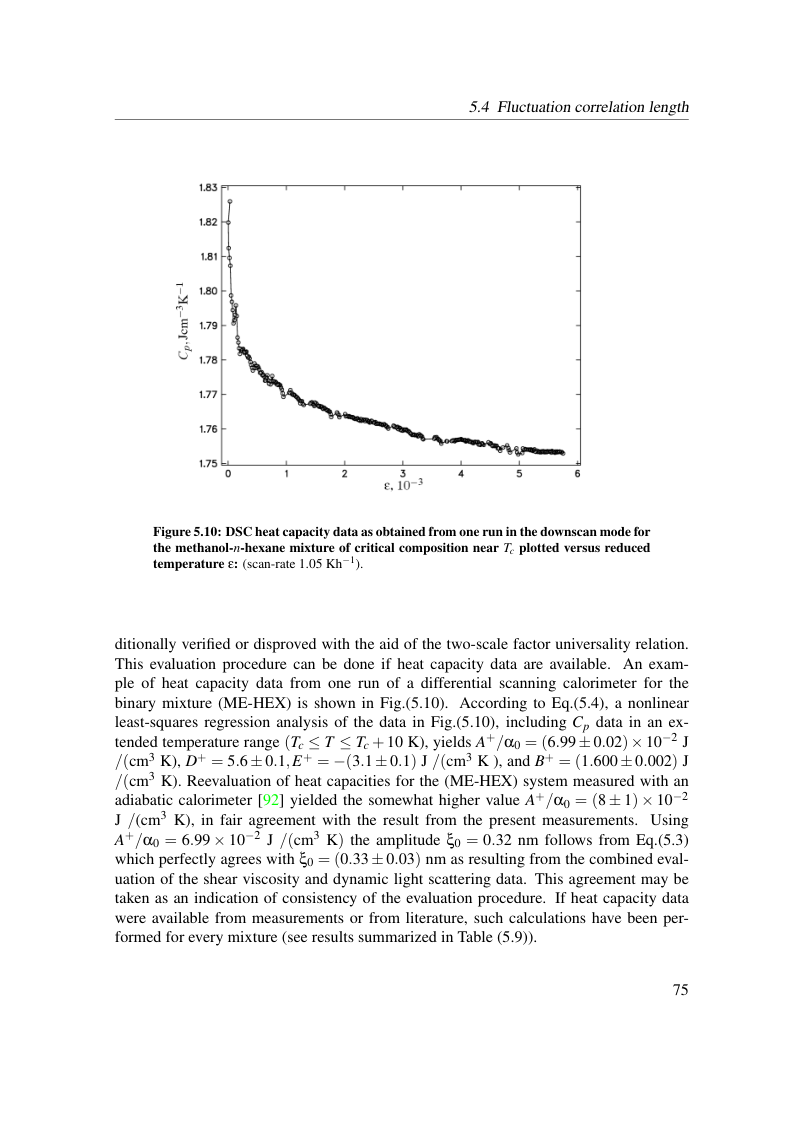
Figure 5.10: DSC heat capacity data as obtained from one run in the downscan mode for the methanol-n-hexane mixture of critical composition near Tc plotted versus reduced temperature ε: (scan-rate 1.05 Kh−1).
ditionally verified or disproved with the aid of the two-scale factor universality relation. This evaluation procedure can be done if heat capacity data are available. An exam- ple of heat capacity data from one run of a differential scanning calorimeter for the binary mixture (ME-HEX) is shown in Fig.(5.10). According to Eq.(5.4), a nonlinear least-squares regression analysis of the data in Fig.(5.10), including Cp data in an ex- tended temperature range (Tc ≤T ≤Tc +10 K), yields A+/α0 = (6.99±0.02)×10−2 J /(cm3 K), D+ = 5.6±0.1,E+ = −(3.1±0.1) J /(cm3 K ), and B+ = (1.600±0.002) J /(cm3 K). Reevaluation of heat capacities for the (ME-HEX) system measured with an adiabatic calorimeter [92] yielded the somewhat higher value A+/α0 = (8 ± 1) × 10−2
J /(cm3 K), in fair agreement with the result from the present measurements. Using A+/α0 = 6.99 × 10⁻² J /(cm3 K) the amplitude ξ0 = 0.32 nm follows from Eq.(5.3) which perfectly agrees with ξ0 = (0.33±0.03) nm as resulting from the combined eval- uation of the shear viscosity and dynamic light scattering data. This agreement may be taken as an indication of consistency of the evaluation procedure. If heat capacity data were available from measurements or from literature, such calculations have been per- formed for every mixture (see results summarized in Table (5.9)).
View original page 81 (authoritative equations, figures and layout)
Original dissertation · PDF page 81 · reader page 72 of 132