Original English dissertation · scientific equations reproduced directly from the source PDF.
5 Experimental Verification of Dynamic Scaling Theories and Discussions
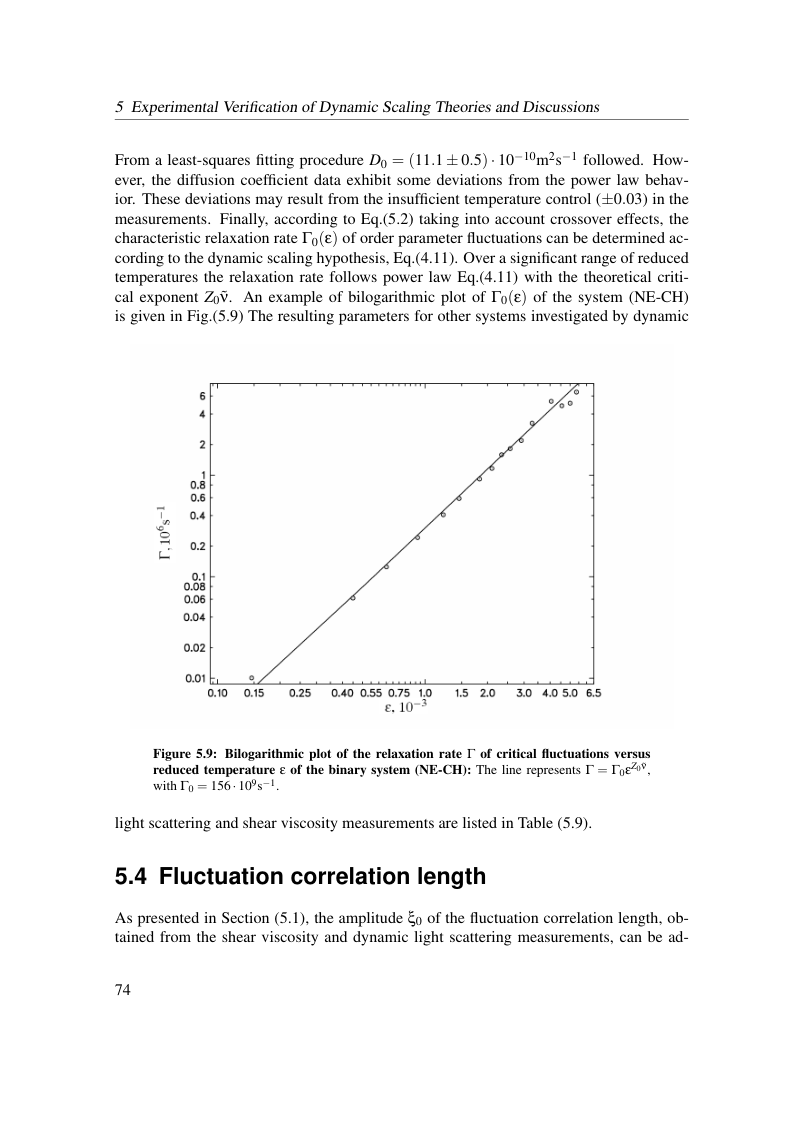
From a least-squares fitting procedure D0 = (11.1 ± 0.5) · 10−10m2s−1 followed. How- ever, the diffusion coefficient data exhibit some deviations from the power law behav- ior. These deviations may result from the insufficient temperature control (±0.03) in the measurements. Finally, according to Eq.(5.2) taking into account crossover effects, the characteristic relaxation rate Γ0(ε) of order parameter fluctuations can be determined ac- cording to the dynamic scaling hypothesis, Eq.(4.11). Over a significant range of reduced temperatures the relaxation rate follows power law Eq.(4.11) with the theoretical criti- cal exponent Z0˜ν. An example of bilogarithmic plot of Γ0(ε) of the system (NE-CH) is given in Fig.(5.9) The resulting parameters for other systems investigated by dynamic
Figure 5.9: Bilogarithmic plot of the relaxation rate Γ of critical fluctuations versus reduced temperature ε of the binary system (NE-CH): The line represents Γ = Γ0εZ0 ˜ν, with Γ0 = 156·109s−1.
light scattering and shear viscosity measurements are listed in Table (5.9).
5.4 Fluctuation correlation length
As presented in Section (5.1), the amplitude ξ0 of the fluctuation correlation length, ob- tained from the shear viscosity and dynamic light scattering measurements, can be ad-
View original page 80 (authoritative equations, figures and layout)
Original dissertation · PDF page 80 · reader page 71 of 132