Original English dissertation · scientific equations reproduced directly from the source PDF.
5.5 Ultrasonic spectrometry
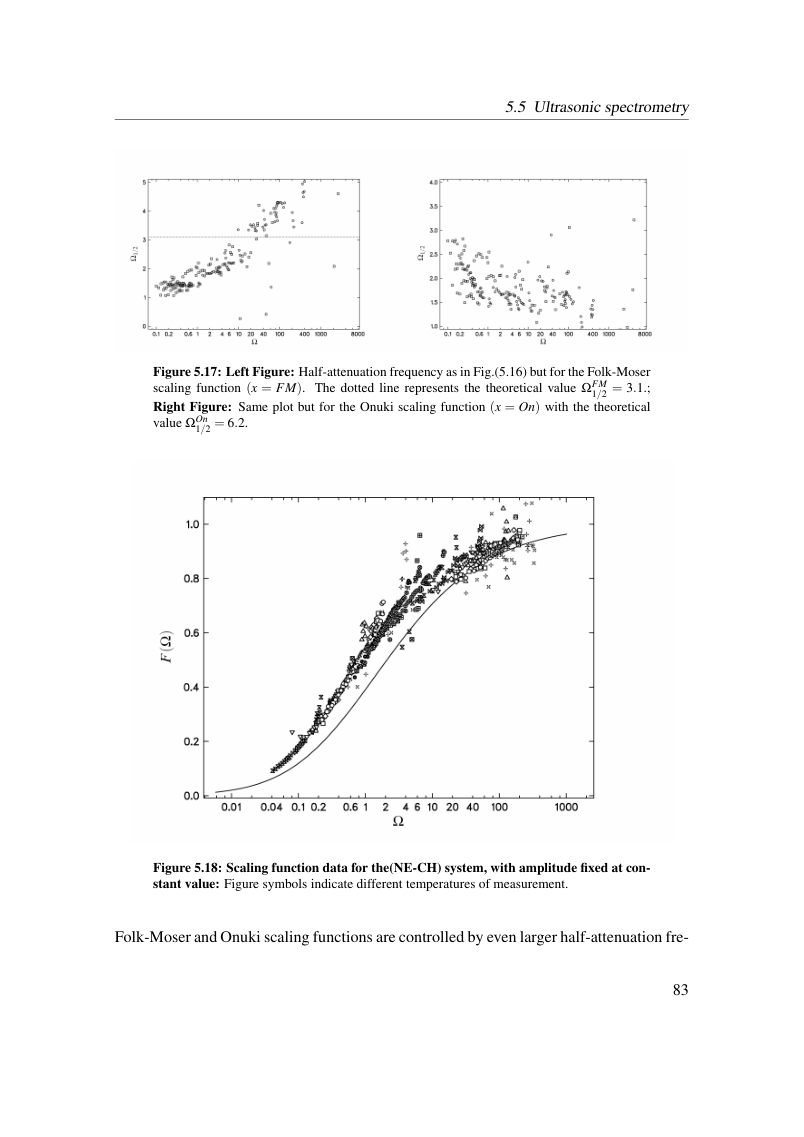
Figure 5.17: Left Figure: Half-attenuation frequency as in Fig.(5.16) but for the Folk-Moser scaling function (x = FM). The dotted line represents the theoretical value ΩFM 1/2 = 3.1.; Right Figure: Same plot but for the Onuki scaling function (x = On) with the theoretical value ΩOn 1/2 = 6.2.
Figure 5.18: Scaling function data for the(NE-CH) system, with amplitude fixed at con- stant value: Figure symbols indicate different temperatures of measurement.
Folk-Moser and Onuki scaling functions are controlled by even larger half-attenuation fre-
View original page 89 (authoritative equations, figures and layout)
Original dissertation · PDF page 89 · reader page 80 of 132