Original English dissertation · scientific equations reproduced directly from the source PDF.
5 Experimental Verification of Dynamic Scaling Theories and Discussions
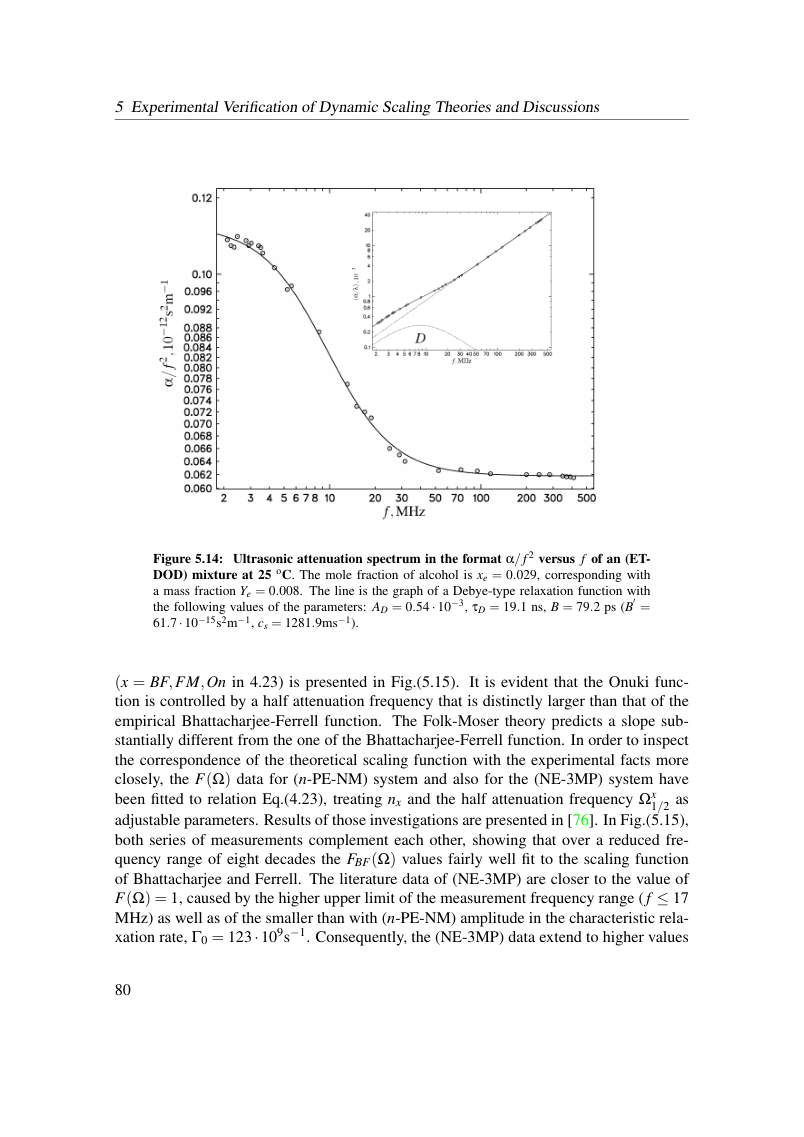
Figure 5.14: Ultrasonic attenuation spectrum in the format α/ f 2 versus f of an (ET- DOD) mixture at 25 oC. The mole fraction of alcohol is xe = 0.029, corresponding with a mass fraction Ye = 0.008. The line is the graph of a Debye-type relaxation function with the following values of the parameters: AD = 0.54 · 10−3, τD = 19.1 ns, B = 79.2 ps (B ′ = 61.7·10−15s2m−1, cs = 1281.9ms−1).
(x = BF,FM,On in 4.23) is presented in Fig.(5.15). It is evident that the Onuki func- tion is controlled by a half attenuation frequency that is distinctly larger than that of the empirical Bhattacharjee-Ferrell function. The Folk-Moser theory predicts a slope sub- stantially different from the one of the Bhattacharjee-Ferrell function. In order to inspect the correspondence of the theoretical scaling function with the experimental facts more closely, the F(Ω) data for (n-PE-NM) system and also for the (NE-3MP) system have been fitted to relation Eq.(4.23), treating nx and the half attenuation frequency Ωx 1/2 as adjustable parameters. Results of those investigations are presented in [76]. In Fig.(5.15), both series of measurements complement each other, showing that over a reduced fre- quency range of eight decades the FBF(Ω) values fairly well fit to the scaling function of Bhattacharjee and Ferrell. The literature data of (NE-3MP) are closer to the value of F(Ω) = 1, caused by the higher upper limit of the measurement frequency range ( f ≤17 MHz) as well as of the smaller than with (n-PE-NM) amplitude in the characteristic rela- xation rate, Γ0 = 123·109s−1. Consequently, the (NE-3MP) data extend to higher values
View original page 86 (authoritative equations, figures and layout)
Original dissertation · PDF page 86 · reader page 77 of 132