Original English dissertation · scientific equations reproduced directly from the source PDF.
5.5 Ultrasonic spectrometry
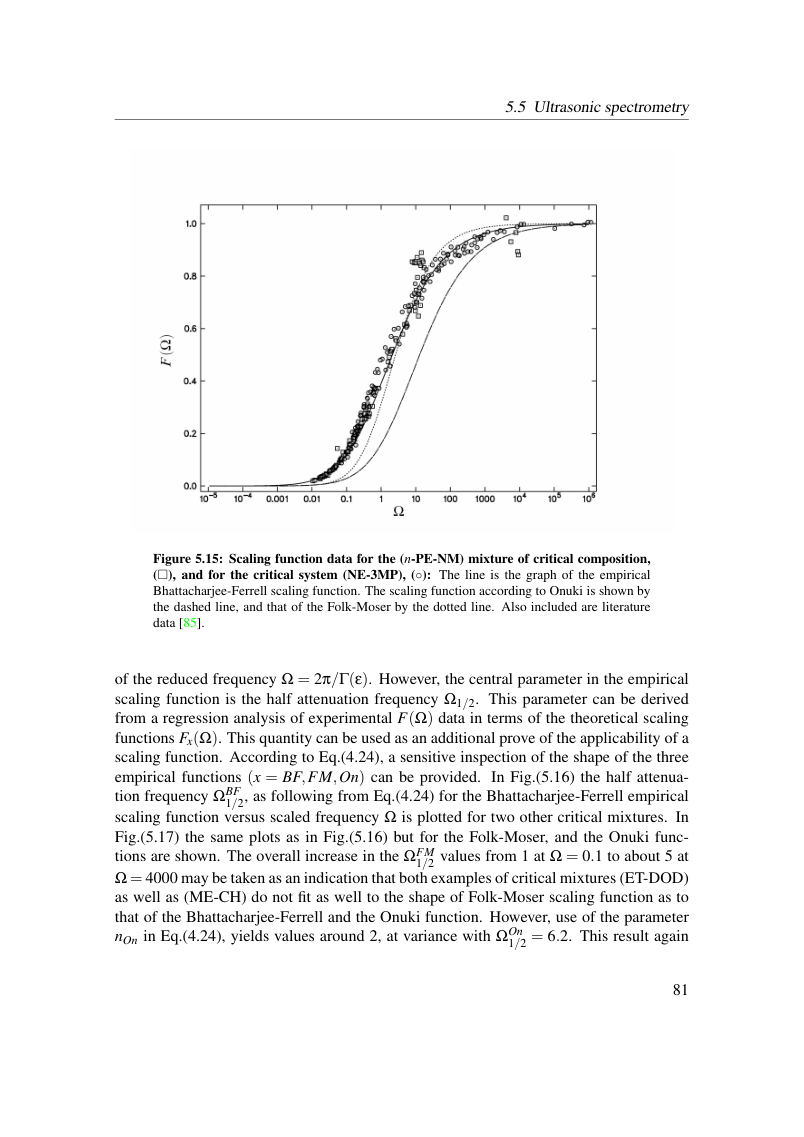
Figure 5.15: Scaling function data for the (n-PE-NM) mixture of critical composition, (□), and for the critical system (NE-3MP), (◦): The line is the graph of the empirical Bhattacharjee-Ferrell scaling function. The scaling function according to Onuki is shown by the dashed line, and that of the Folk-Moser by the dotted line. Also included are literature data [85].
of the reduced frequency Ω= 2π/Γ(ε). However, the central parameter in the empirical scaling function is the half attenuation frequency Ω1/2. This parameter can be derived from a regression analysis of experimental F(Ω) data in terms of the theoretical scaling functions Fx(Ω). This quantity can be used as an additional prove of the applicability of a scaling function. According to Eq.(4.24), a sensitive inspection of the shape of the three empirical functions (x = BF,FM,On) can be provided. In Fig.(5.16) the half attenua- tion frequency ΩBF 1/2, as following from Eq.(4.24) for the Bhattacharjee-Ferrell empirical scaling function versus scaled frequency Ωis plotted for two other critical mixtures. In Fig.(5.17) the same plots as in Fig.(5.16) but for the Folk-Moser, and the Onuki func- tions are shown. The overall increase in the ΩFM 1/2 values from 1 at Ω= 0.1 to about 5 at Ω= 4000 may be taken as an indication that both examples of critical mixtures (ET-DOD) as well as (ME-CH) do not fit as well to the shape of Folk-Moser scaling function as to that of the Bhattacharjee-Ferrell and the Onuki function. However, use of the parameter nOn in Eq.(4.24), yields values around 2, at variance with ΩOn 1/2 = 6.2. This result again
View original page 87 (authoritative equations, figures and layout)
Original dissertation · PDF page 87 · reader page 78 of 132