Original English dissertation · scientific equations reproduced directly from the source PDF.
5 Experimental Verification of Dynamic Scaling Theories and Discussions
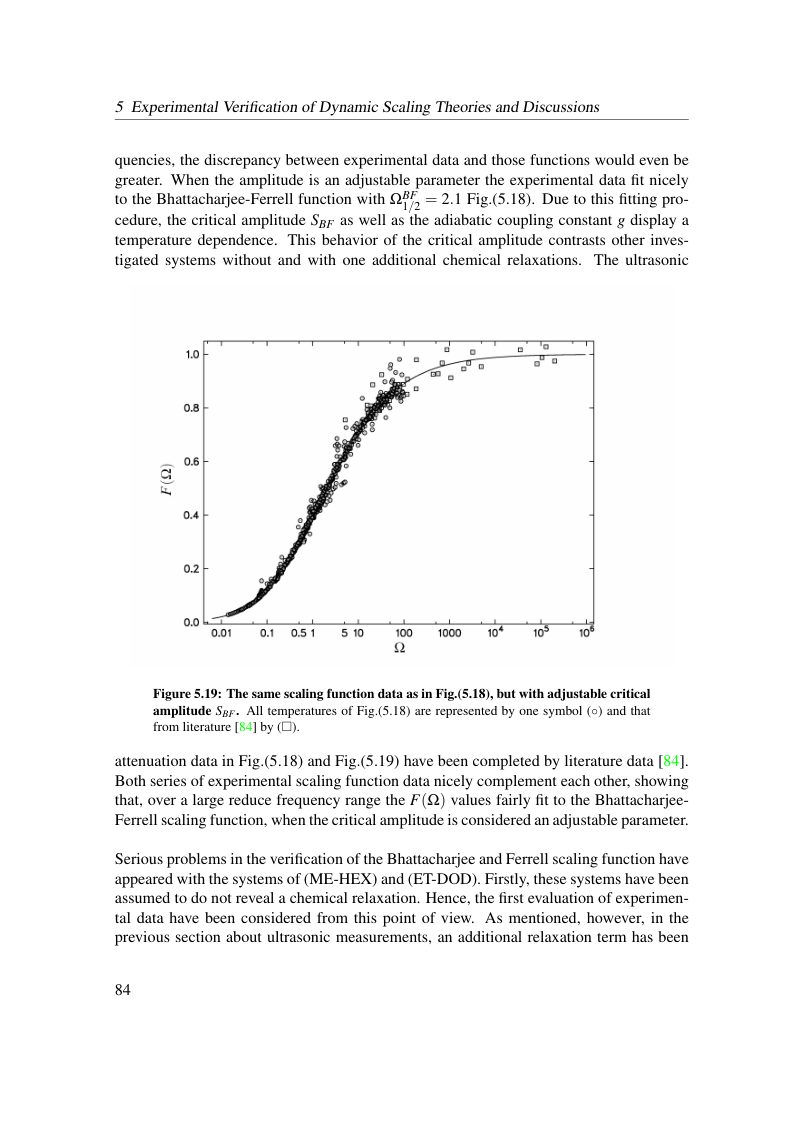
quencies, the discrepancy between experimental data and those functions would even be greater. When the amplitude is an adjustable parameter the experimental data fit nicely to the Bhattacharjee-Ferrell function with ΩBF 1/2 = 2.1 Fig.(5.18). Due to this fitting pro- cedure, the critical amplitude SBF as well as the adiabatic coupling constant g display a temperature dependence. This behavior of the critical amplitude contrasts other inves- tigated systems without and with one additional chemical relaxations. The ultrasonic
Figure 5.19: The same scaling function data as in Fig.(5.18), but with adjustable critical amplitude SBF. All temperatures of Fig.(5.18) are represented by one symbol (◦) and that from literature [84] by (□).
attenuation data in Fig.(5.18) and Fig.(5.19) have been completed by literature data [84]. Both series of experimental scaling function data nicely complement each other, showing that, over a large reduce frequency range the F(Ω) values fairly fit to the Bhattacharjee- Ferrell scaling function, when the critical amplitude is considered an adjustable parameter.
Serious problems in the verification of the Bhattacharjee and Ferrell scaling function have appeared with the systems of (ME-HEX) and (ET-DOD). Firstly, these systems have been assumed to do not reveal a chemical relaxation. Hence, the first evaluation of experimen- tal data have been considered from this point of view. As mentioned, however, in the previous section about ultrasonic measurements, an additional relaxation term has been
View original page 90 (authoritative equations, figures and layout)
Original dissertation · PDF page 90 · reader page 81 of 132