Original English dissertation · scientific equations reproduced directly from the source PDF.
3 Experimental Methods
geometry ft Rt R l fc V Rc range error [MHz] [mm] [mm] [mm] [kHz] [cm3] [m] [MHz] ∆α/α
plane-concave 1 40 35 19 40 75 2.0 0.1 – 2.7 5 - 10%
bi-concave 7 10 8.4 5 125 1.3 3 0.4 – 13 5 - 10%
Table 3.1: Resonator dates: ft : fundamental frequency of the piezo-transducer ; Rt : trans- ducer radius; R : cell radius; l : cell length; fc : fundamental frequency of the cell; V : liquid volume and Rc : radius of curvature of transducer.
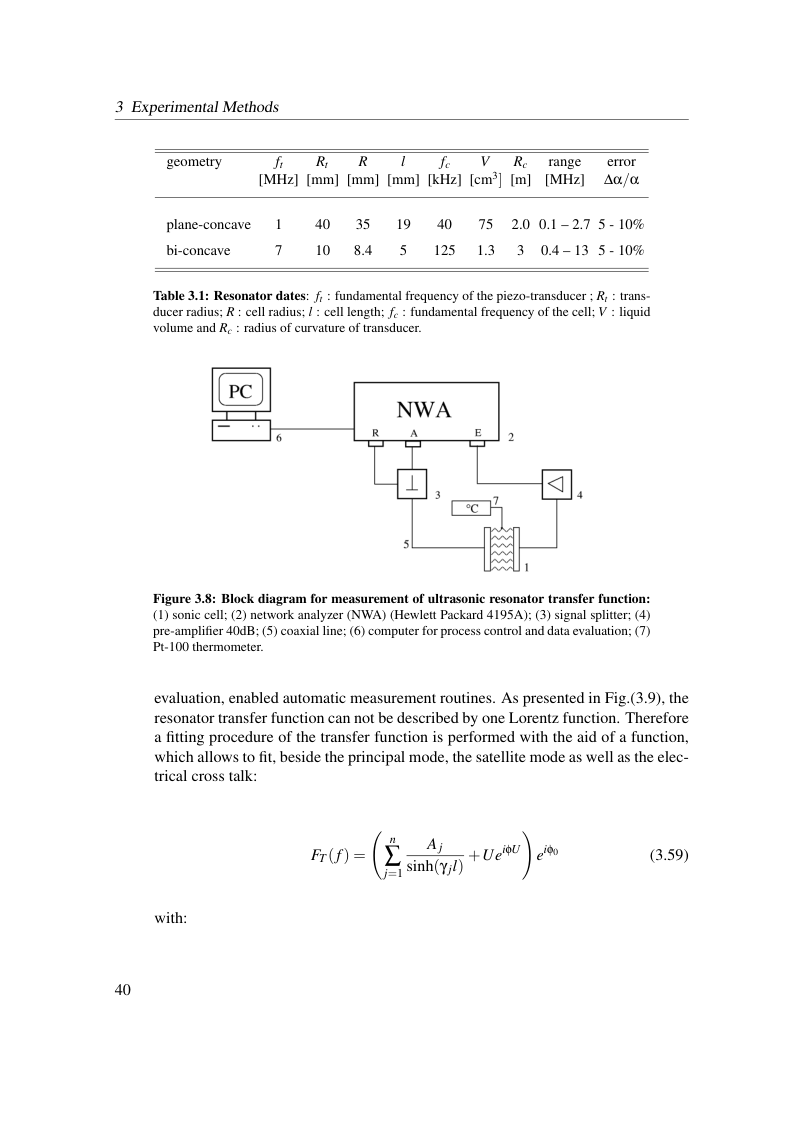
Figure 3.8: Block diagram for measurement of ultrasonic resonator transfer function: (1) sonic cell; (2) network analyzer (NWA) (Hewlett Packard 4195A); (3) signal splitter; (4) pre-amplifier 40dB; (5) coaxial line; (6) computer for process control and data evaluation; (7) Pt-100 thermometer.
evaluation, enabled automatic measurement routines. As presented in Fig.(3.9), the resonator transfer function can not be described by one Lorentz function. Therefore a fitting procedure of the transfer function is performed with the aid of a function, which allows to fit, beside the principal mode, the satellite mode as well as the elec- trical cross talk:

with:
View original page 46 (authoritative equations, figures and layout)
Original dissertation · PDF page 46 · reader page 38 of 132