Original English dissertation · scientific equations reproduced directly from the source PDF.
5 Experimental Verification of Dynamic Scaling Theories and Discussions
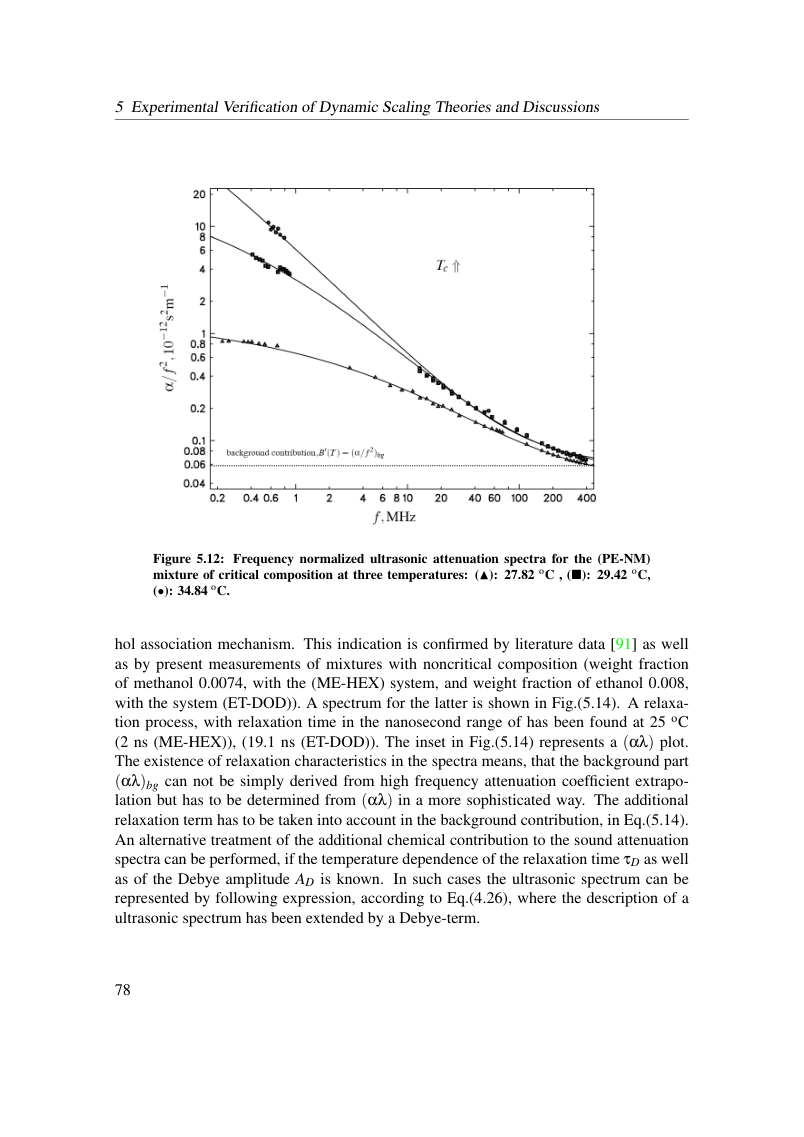
Figure 5.12: Frequency normalized ultrasonic attenuation spectra for the (PE-NM) mixture of critical composition at three temperatures: (▲): 27.82 oC , (■): 29.42 oC, (•): 34.84 oC.
hol association mechanism. This indication is confirmed by literature data [91] as well as by present measurements of mixtures with noncritical composition (weight fraction of methanol 0.0074, with the (ME-HEX) system, and weight fraction of ethanol 0.008, with the system (ET-DOD)). A spectrum for the latter is shown in Fig.(5.14). A relaxa- tion process, with relaxation time in the nanosecond range of has been found at 25 oC (2 ns (ME-HEX)), (19.1 ns (ET-DOD)). The inset in Fig.(5.14) represents a (αλ) plot. The existence of relaxation characteristics in the spectra means, that the background part (αλ)bg can not be simply derived from high frequency attenuation coefficient extrapo- lation but has to be determined from (αλ) in a more sophisticated way. The additional relaxation term has to be taken into account in the background contribution, in Eq.(5.14). An alternative treatment of the additional chemical contribution to the sound attenuation spectra can be performed, if the temperature dependence of the relaxation time τD as well as of the Debye amplitude AD is known. In such cases the ultrasonic spectrum can be represented by following expression, according to Eq.(4.26), where the description of a ultrasonic spectrum has been extended by a Debye-term.
View original page 84 (authoritative equations, figures and layout)
Original dissertation · PDF page 84 · reader page 75 of 132