Original English dissertation · scientific equations reproduced directly from the source PDF.
5 Experimental Verification of Dynamic Scaling Theories and Discussions
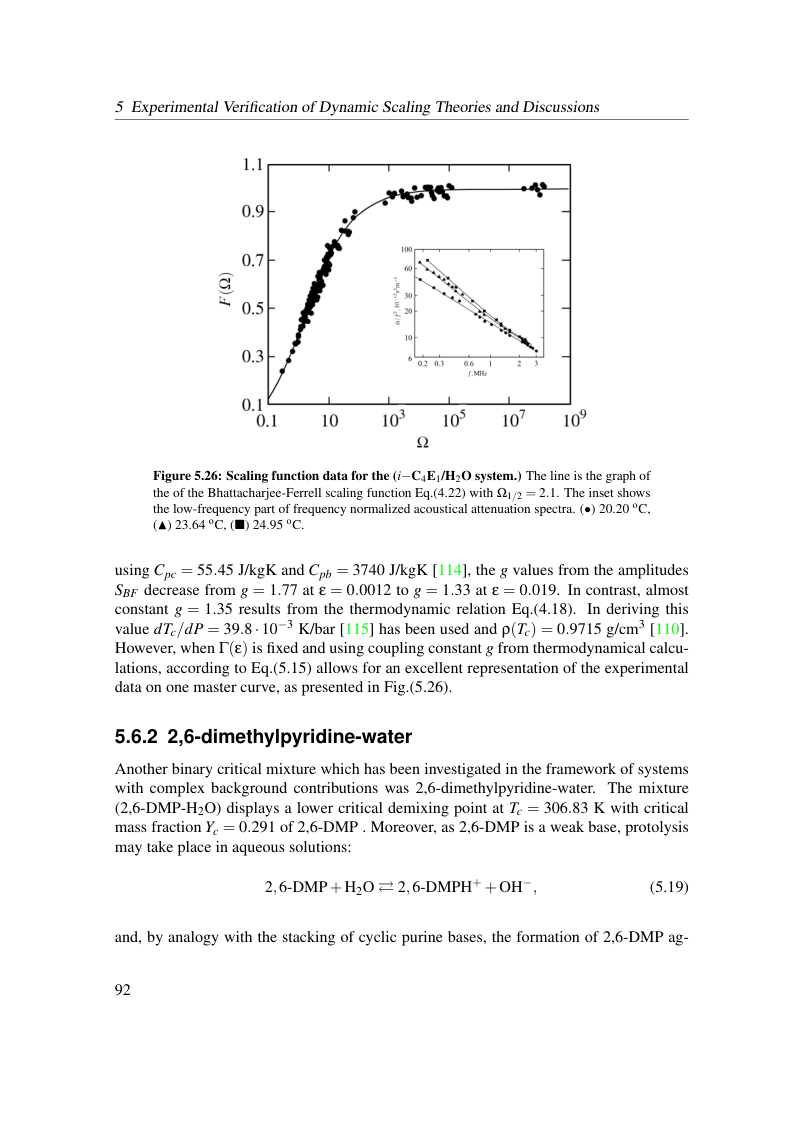
Figure 5.26: Scaling function data for the (i−C4E1/H2O system.) The line is the graph of the of the Bhattacharjee-Ferrell scaling function Eq.(4.22) with Ω1/2 = 2.1. The inset shows the low-frequency part of frequency normalized acoustical attenuation spectra. (•) 20.20 oC, (▲) 23.64 oC, (■) 24.95 oC.
using Cpc = 55.45 J/kgK and Cpb = 3740 J/kgK [114], the g values from the amplitudes SBF decrease from g = 1.77 at ε = 0.0012 to g = 1.33 at ε = 0.019. In contrast, almost constant g = 1.35 results from the thermodynamic relation Eq.(4.18). In deriving this value dTc/dP = 39.8·10−3 K/bar [115] has been used and ρ(Tc) = 0.9715 g/cm3 [110]. However, when Γ(ε) is fixed and using coupling constant g from thermodynamical calcu- lations, according to Eq.(5.15) allows for an excellent representation of the experimental data on one master curve, as presented in Fig.(5.26).
5.6.2 2,6-dimethylpyridine-water
Another binary critical mixture which has been investigated in the framework of systems with complex background contributions was 2,6-dimethylpyridine-water. The mixture (2,6-DMP-H2O) displays a lower critical demixing point at Tc = 306.83 K with critical mass fraction Yc = 0.291 of 2,6-DMP . Moreover, as 2,6-DMP is a weak base, protolysis may take place in aqueous solutions:

and, by analogy with the stacking of cyclic purine bases, the formation of 2,6-DMP ag-
View original page 98 (authoritative equations, figures and layout)
Original dissertation · PDF page 98 · reader page 89 of 132