Original English dissertation · scientific equations reproduced directly from the source PDF.
5 Experimental Verification of Dynamic Scaling Theories and Discussions
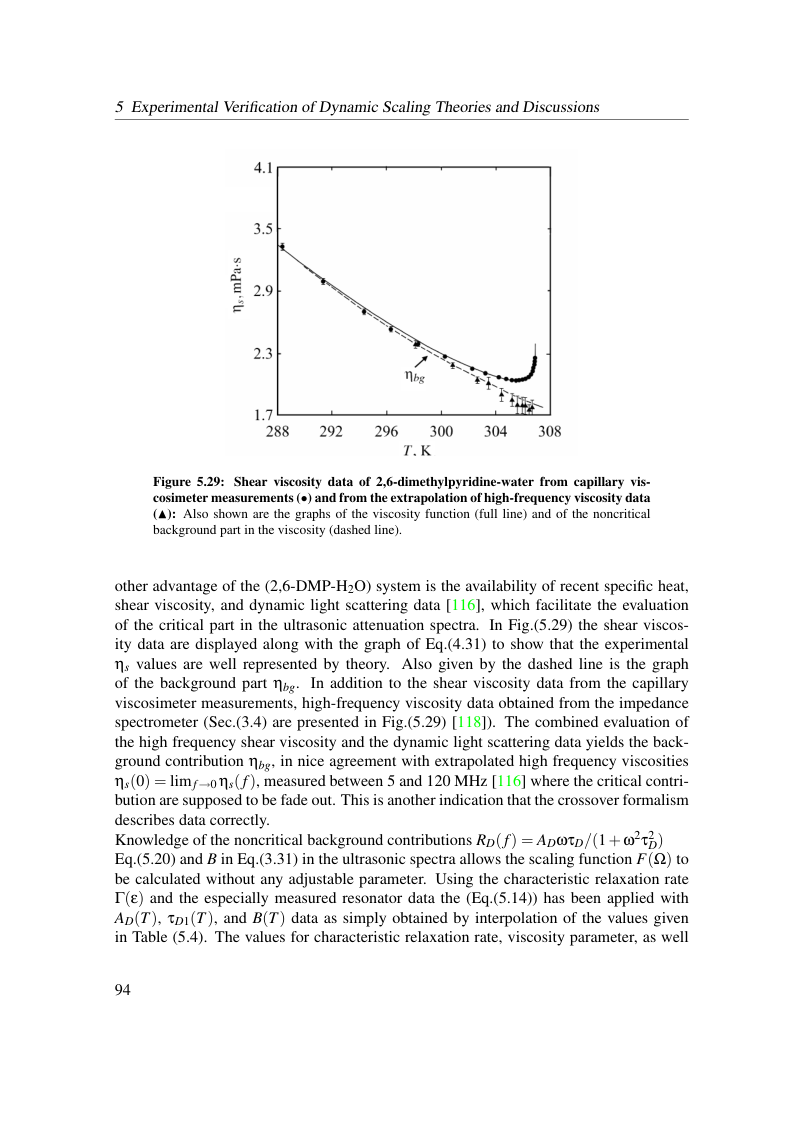
Figure 5.29: Shear viscosity data of 2,6-dimethylpyridine-water from capillary vis- cosimeter measurements (•) and from the extrapolation of high-frequency viscosity data (▲): Also shown are the graphs of the viscosity function (full line) and of the noncritical background part in the viscosity (dashed line).
other advantage of the (2,6-DMP-H2O) system is the availability of recent specific heat, shear viscosity, and dynamic light scattering data [116], which facilitate the evaluation of the critical part in the ultrasonic attenuation spectra. In Fig.(5.29) the shear viscos- ity data are displayed along with the graph of Eq.(4.31) to show that the experimental ηs values are well represented by theory. Also given by the dashed line is the graph of the background part ηbg. In addition to the shear viscosity data from the capillary viscosimeter measurements, high-frequency viscosity data obtained from the impedance spectrometer (Sec.(3.4) are presented in Fig.(5.29) [118]). The combined evaluation of the high frequency shear viscosity and the dynamic light scattering data yields the back- ground contribution ηbg, in nice agreement with extrapolated high frequency viscosities ηs(0) = lim f→0 ηs(f), measured between 5 and 120 MHz [116] where the critical contri- bution are supposed to be fade out. This is another indication that the crossover formalism describes data correctly. Knowledge of the noncritical background contributions RD(f) = ADωτD/(1+ω2τ2 D) Eq.(5.20) and B in Eq.(3.31) in the ultrasonic spectra allows the scaling function F(Ω) to be calculated without any adjustable parameter. Using the characteristic relaxation rate Γ(ε) and the especially measured resonator data the (Eq.(5.14)) has been applied with AD(T), τD1(T), and B(T) data as simply obtained by interpolation of the values given in Table (5.4). The values for characteristic relaxation rate, viscosity parameter, as well
View original page 100 (authoritative equations, figures and layout)
Original dissertation · PDF page 100 · reader page 91 of 132