Original English dissertation · scientific equations reproduced directly from the source PDF.
5.6 Systems with complex background contributions
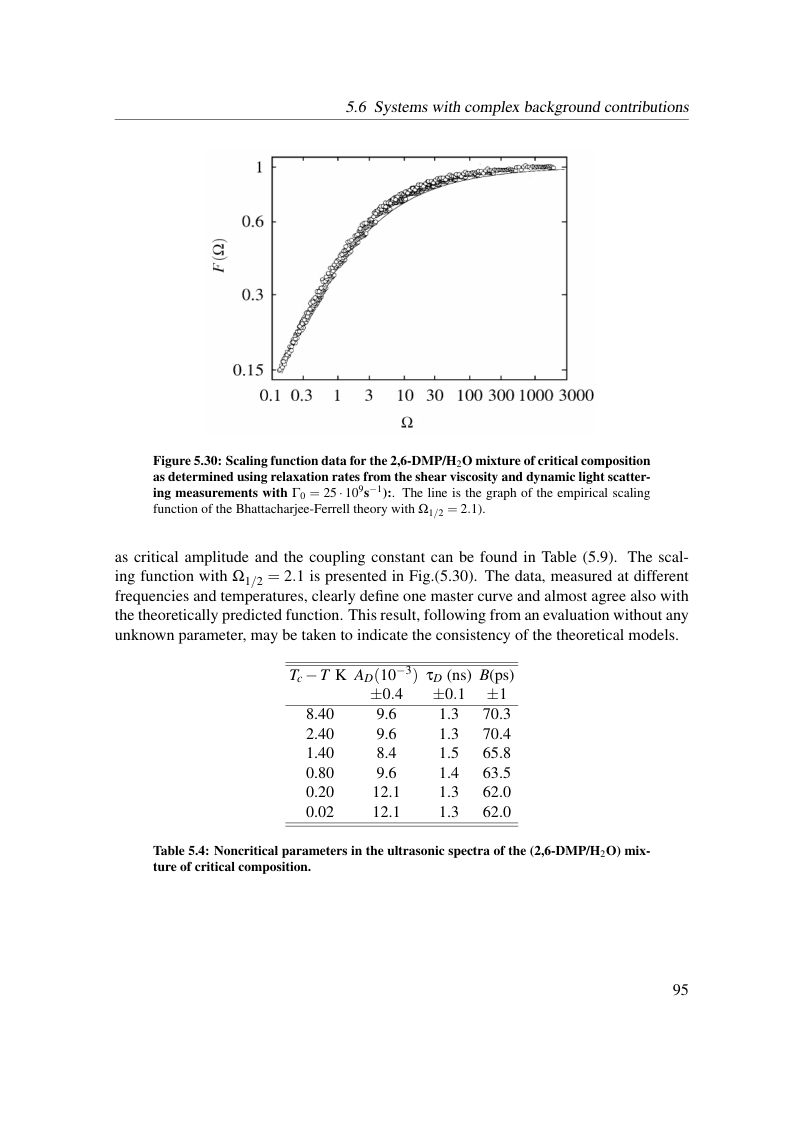
Figure 5.30: Scaling function data for the 2,6-DMP/H2O mixture of critical composition as determined using relaxation rates from the shear viscosity and dynamic light scatter- ing measurements with Γ0 = 25 · 109s−1):. The line is the graph of the empirical scaling function of the Bhattacharjee-Ferrell theory with Ω1/2 = 2.1).
as critical amplitude and the coupling constant can be found in Table (5.9). The scal- ing function with Ω1/2 = 2.1 is presented in Fig.(5.30). The data, measured at different frequencies and temperatures, clearly define one master curve and almost agree also with the theoretically predicted function. This result, following from an evaluation without any unknown parameter, may be taken to indicate the consistency of the theoretical models.
Tc −T K AD(10−3) τD (ns) B(ps) ±0.4 ±0.1 ±1 8.40 9.6 1.3 70.3 2.40 9.6 1.3 70.4 1.40 8.4 1.5 65.8 0.80 9.6 1.4 63.5 0.20 12.1 1.3 62.0 0.02 12.1 1.3 62.0
Table 5.4: Noncritical parameters in the ultrasonic spectra of the (2,6-DMP/H2O) mix- ture of critical composition.
View original page 101 (authoritative equations, figures and layout)
Original dissertation · PDF page 101 · reader page 92 of 132