Original English dissertation · scientific equations reproduced directly from the source PDF.
3 Experimental Methods

τ = 2−10 µs. From this relation it is evident that the knowledge of the sound velocity cs of the liquid sample is essential for correct pulse adjustments.
• Sound velocity measurements: The transducer and the receiver have to be brought to a distance fulfilling X < τc/2 or X < 3/α. At the range of 20 · λ, the transfer function is measured and the experimental data at constant frequency are fitted to Eq.(3.62). Finally, with the help of cs = λ· f, the sound velocity cs can be calculated.
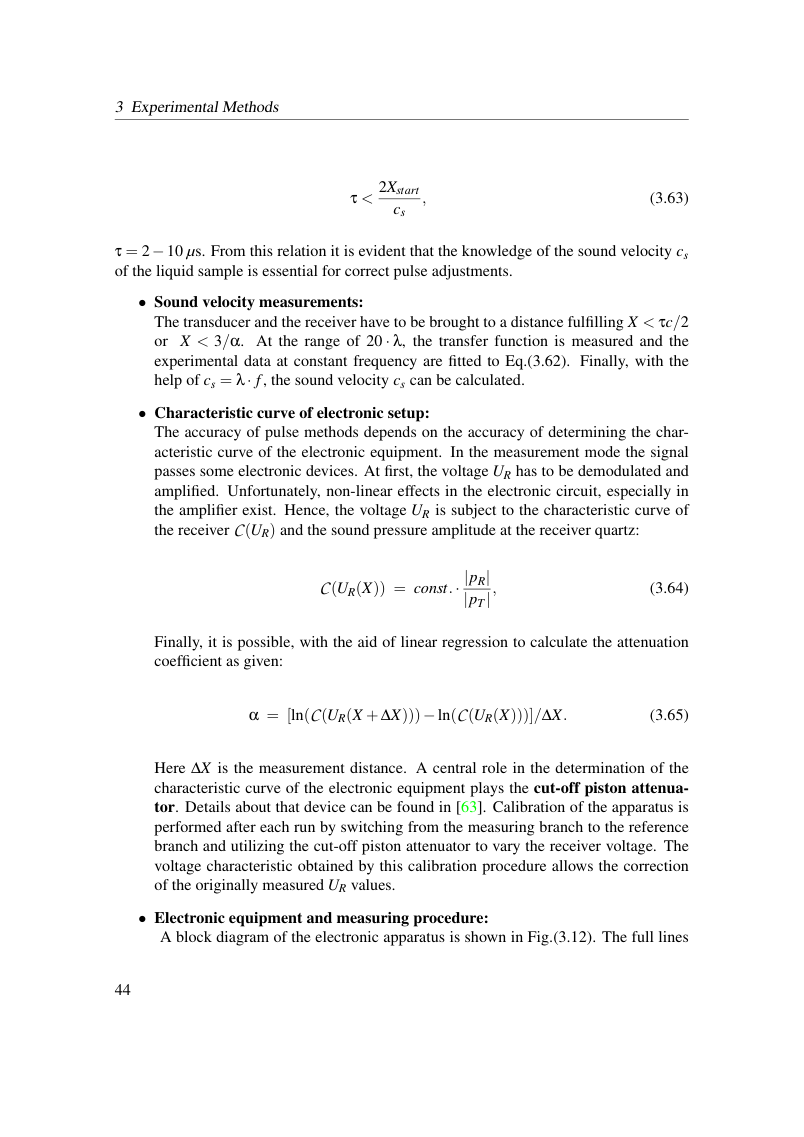
• Characteristic curve of electronic setup: The accuracy of pulse methods depends on the accuracy of determining the char- acteristic curve of the electronic equipment. In the measurement mode the signal passes some electronic devices. At first, the voltage UR has to be demodulated and amplified. Unfortunately, non-linear effects in the electronic circuit, especially in the amplifier exist. Hence, the voltage UR is subject to the characteristic curve of the receiver C(UR) and the sound pressure amplitude at the receiver quartz:

Finally, it is possible, with the aid of linear regression to calculate the attenuation coefficient as given:

Here ∆X is the measurement distance. A central role in the determination of the characteristic curve of the electronic equipment plays the cut-off piston attenua- tor. Details about that device can be found in [63]. Calibration of the apparatus is performed after each run by switching from the measuring branch to the reference branch and utilizing the cut-off piston attenuator to vary the receiver voltage. The voltage characteristic obtained by this calibration procedure allows the correction of the originally measured UR values.
• Electronic equipment and measuring procedure: A block diagram of the electronic apparatus is shown in Fig.(3.12). The full lines
View original page 50 (authoritative equations, figures and layout)
Original dissertation · PDF page 50 · reader page 42 of 132