Original English dissertation · scientific equations reproduced directly from the source PDF.
5.6 Systems with complex background contributions
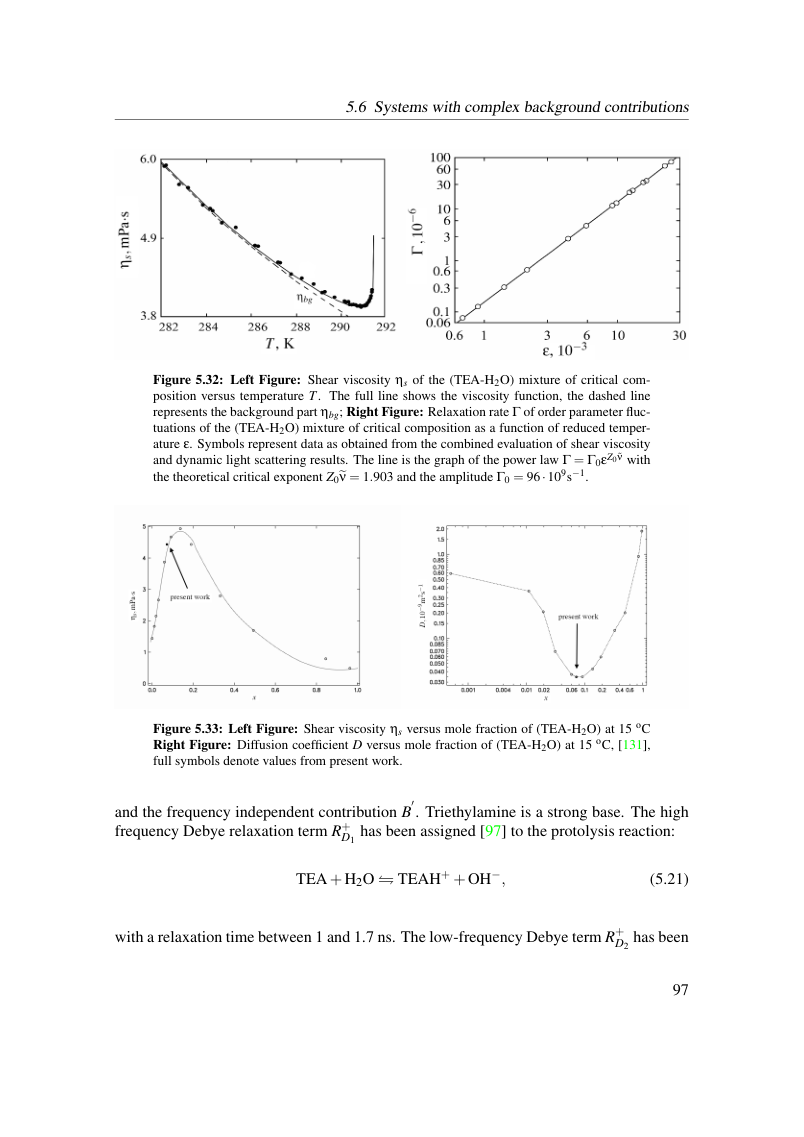
Figure 5.32: Left Figure: Shear viscosity ηs of the (TEA-H2O) mixture of critical com- position versus temperature T. The full line shows the viscosity function, the dashed line represents the background part ηbg; Right Figure: Relaxation rate Γ of order parameter fluc- tuations of the (TEA-H2O) mixture of critical composition as a function of reduced temper- ature ε. Symbols represent data as obtained from the combined evaluation of shear viscosity and dynamic light scattering results. The line is the graph of the power law Γ = Γ0εZ0 ˜ν with the theoretical critical exponent Z0eν = 1.903 and the amplitude Γ0 = 96·109s−1.
Figure 5.33: Left Figure: Shear viscosity ηs versus mole fraction of (TEA-H2O) at 15 oC Right Figure: Diffusion coefficient D versus mole fraction of (TEA-H2O) at 15 oC, [131], full symbols denote values from present work.
and the frequency independent contribution B ′. Triethylamine is a strong base. The high frequency Debye relaxation term R+ D1 has been assigned [97] to the protolysis reaction:

with a relaxation time between 1 and 1.7 ns. The low-frequency Debye term R+ D2 has been
View original page 103 (authoritative equations, figures and layout)
Original dissertation · PDF page 103 · reader page 94 of 132